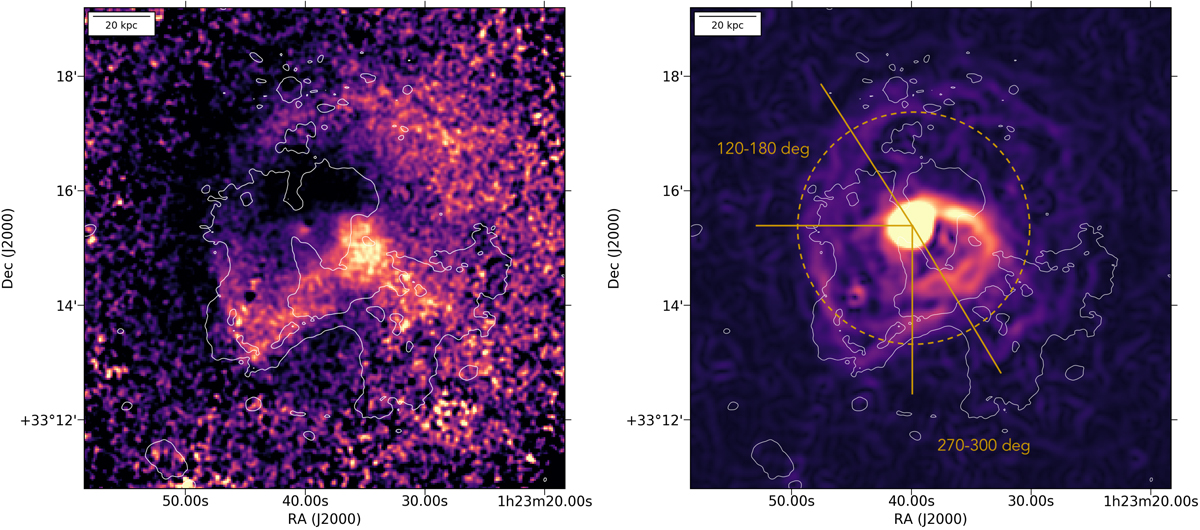
Fig. 9.
Download original image
Left: XMM-Newton 0.7–2 keV-band residual map obtained by subtracting the best-fit β-model for the data from the image shown in Fig. 4. Right: XMM-Newton 0.7–2 keV-band filtered with the Gaussian Gradient Method with σ = 3 pixels (1 pixel is 2 arcsec). The 3σ LOFAR contour at 144-MHz with 5.57 arcsec × 8.09 arcsec resolution is overlaid. Yellow lines in the right panel show the sectors used to extract the profiles shown in Fig. 10. A dashed circle indicates the approximate distance of the E and S brightness discontinuities from the X-ray emission peak, equal to ∼2 arcmin.
Current usage metrics show cumulative count of Article Views (full-text article views including HTML views, PDF and ePub downloads, according to the available data) and Abstracts Views on Vision4Press platform.
Data correspond to usage on the plateform after 2015. The current usage metrics is available 48-96 hours after online publication and is updated daily on week days.
Initial download of the metrics may take a while.