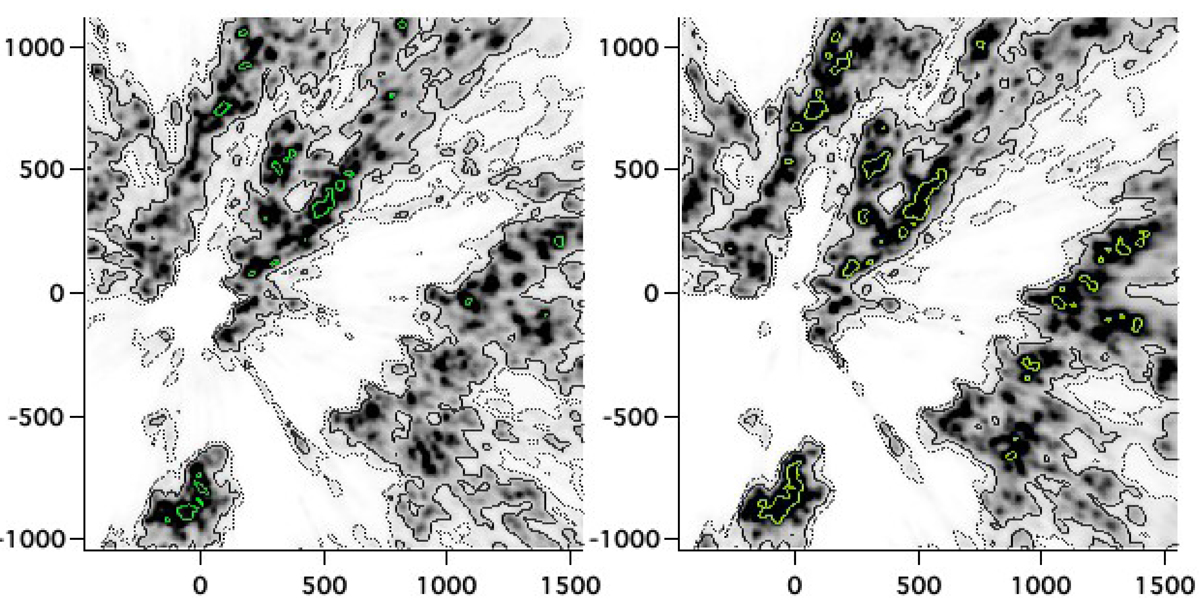
Fig. 5.
Download original image
Comparison between the new eDR3 inverted extinction density and the previous result using Gaia DR2. Here we focus on the fraction of the 3D map containing the densest regions of the Local Arm, the so-called split, and Sagittarius. Left: Gaia DR2 map (Lallement et al. 2019). Right: Gaia EDR3 map. The green contours mark the densest areas, with the same level of 0.01 mag pc−1 in the two maps. We note the increased fraction of areas above this value, and, on the contrary, the disappearance of faint artefacts within the cavities, which are both due to reduced uncertainties on distances and estimated extinctions. The local cavity around the Sun is better defined thanks to the addition of nearby, bright targets, and it appears narrower.
Current usage metrics show cumulative count of Article Views (full-text article views including HTML views, PDF and ePub downloads, according to the available data) and Abstracts Views on Vision4Press platform.
Data correspond to usage on the plateform after 2015. The current usage metrics is available 48-96 hours after online publication and is updated daily on week days.
Initial download of the metrics may take a while.