Fig. 2.
Download original image
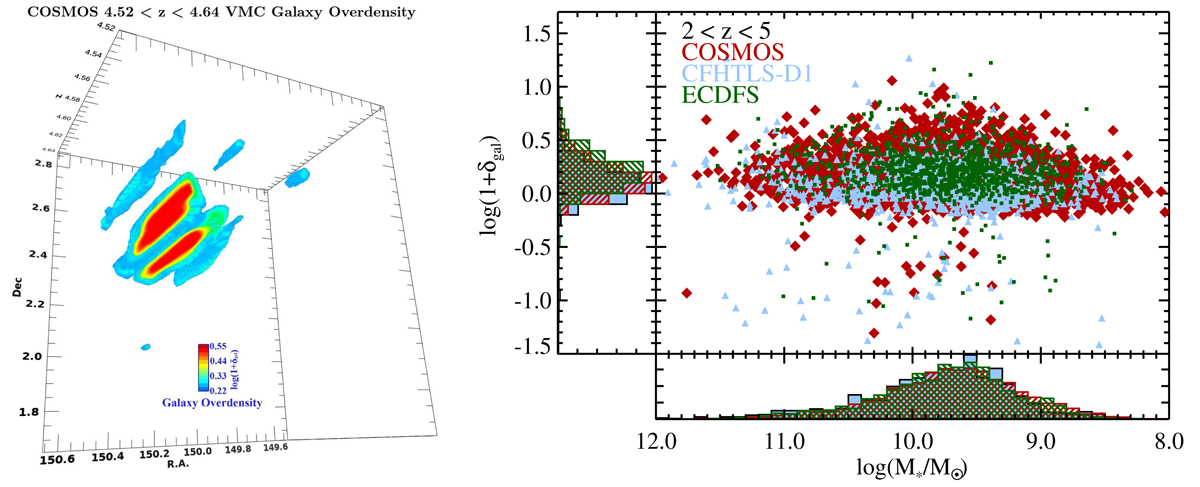
Galaxy overdensity reconstruction using the VMC mapping method. Left: example of our VMC overdensity mapping (see Sect. 2.4) as applied to the COSMOS field in the redshift range 4.52 ≤ z ≤ 4.64, nearly an identical range as is shown in Fig. 1. The main structure seen in the mapping is again the PCl J1001+0220 proto-cluster at z ∼ 4.57. Here, in addition to showing the transverse dimensions, we also show the extent of the structure in the third dimension, redshift, which extends in this cube between 4.52 ≤ z ≤ 4.64. The redshift dimension is added by rendering the narrow redshift slices used in our analysis to define galaxy overdensity rather than employing a single slice over the redshift extent of the proto-cluster as was done in Fig. 1. The scale bar in the lower right shows the galaxy overdensity values, with the lower and upper end of the dynamic range corresponding the “Intermediate” and “Peak” regions as defined in Sect. 3.1. Right: distribution of the full VUDS+ spectral sample in M* and log(1 + δgal) for the three separate fields targeted by VUDS (ECDFS: small green squares, CFHTLS-D1: light blue triangles, COSMOS: large red diamonds). The redshift range imposed on the plotted galaxies is shown in the top left. Area-normalized histograms for the three fields for both parameters are shown on the side of the plot. The three fields show generally similar distributions in both parameters, with a slight excess of galaxies at higher log(1 + δgal) observed in COSMOS and ECDFS.
Current usage metrics show cumulative count of Article Views (full-text article views including HTML views, PDF and ePub downloads, according to the available data) and Abstracts Views on Vision4Press platform.
Data correspond to usage on the plateform after 2015. The current usage metrics is available 48-96 hours after online publication and is updated daily on week days.
Initial download of the metrics may take a while.