Fig. 3.
Download original image
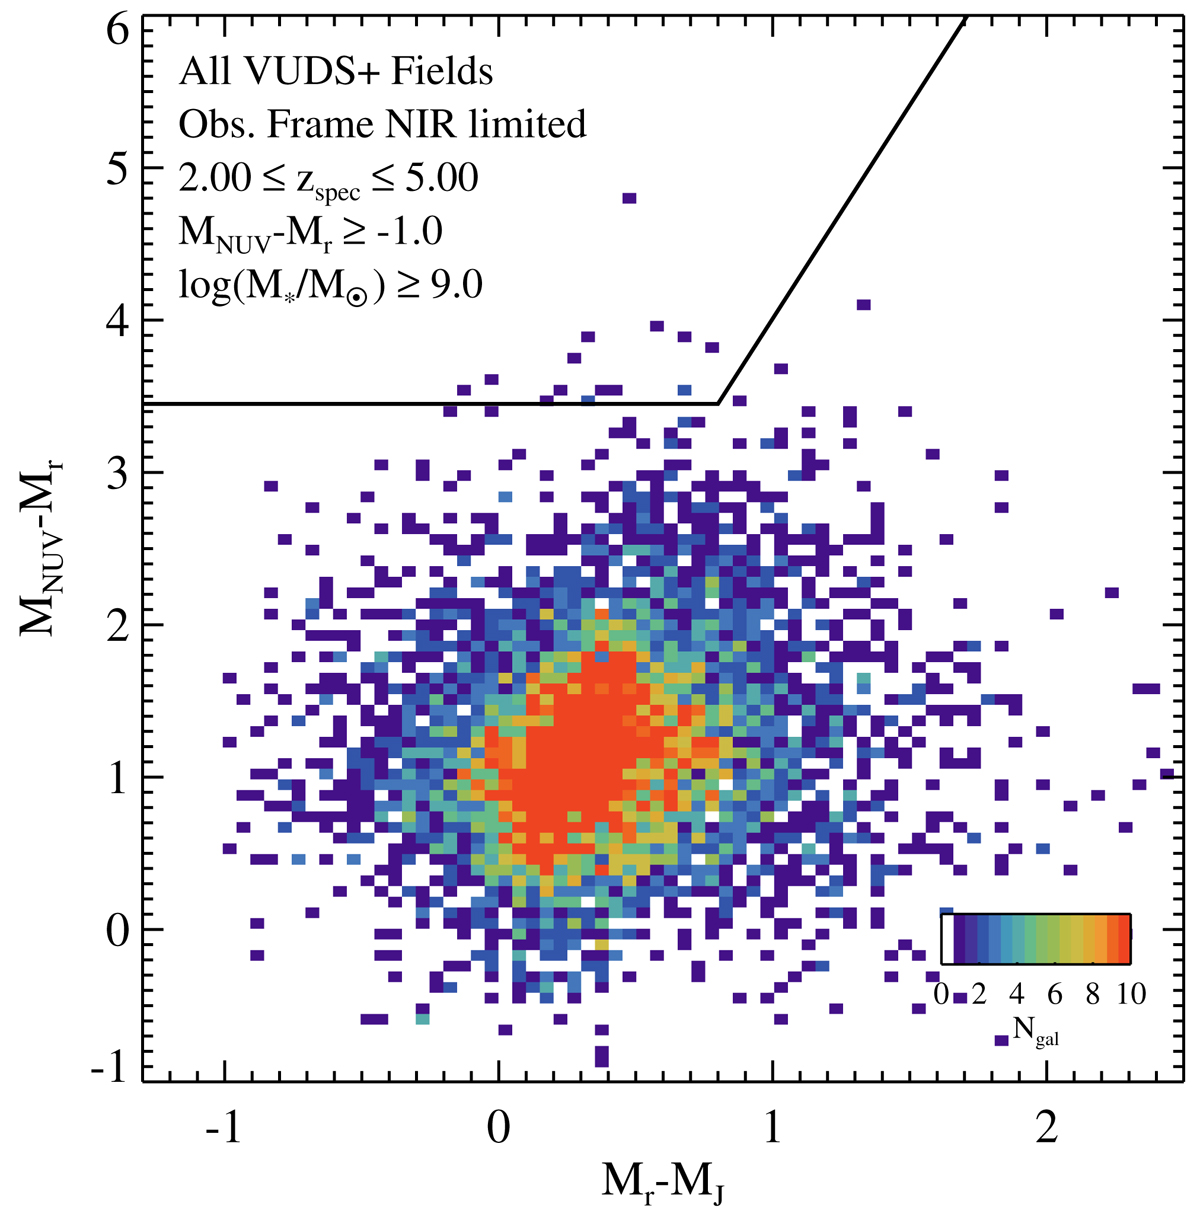
Rest-frame MNUV − Mr vs. Mr − MJ color–color diagram of the galaxies in the final spectral sample that satisfy the stellar mass, redshift, and MNUV − Mr limits given in the top left as well as the observed-frame NIR photometric cuts mentioned in Sect. 2.4. A color bar on the bottom right indicates the color that corresponds to the number of galaxies in each two-dimensional bin. The black lines delineate color-color regions that are inhabited by quiescent (top left) and star-forming (bottom) galaxies adopted from regions defined for a sample in a similar redshift in Lemaux et al. (2014b). The sample shown here is primarily composed of star-forming galaxies containing low to moderate amounts of dust.
Current usage metrics show cumulative count of Article Views (full-text article views including HTML views, PDF and ePub downloads, according to the available data) and Abstracts Views on Vision4Press platform.
Data correspond to usage on the plateform after 2015. The current usage metrics is available 48-96 hours after online publication and is updated daily on week days.
Initial download of the metrics may take a while.