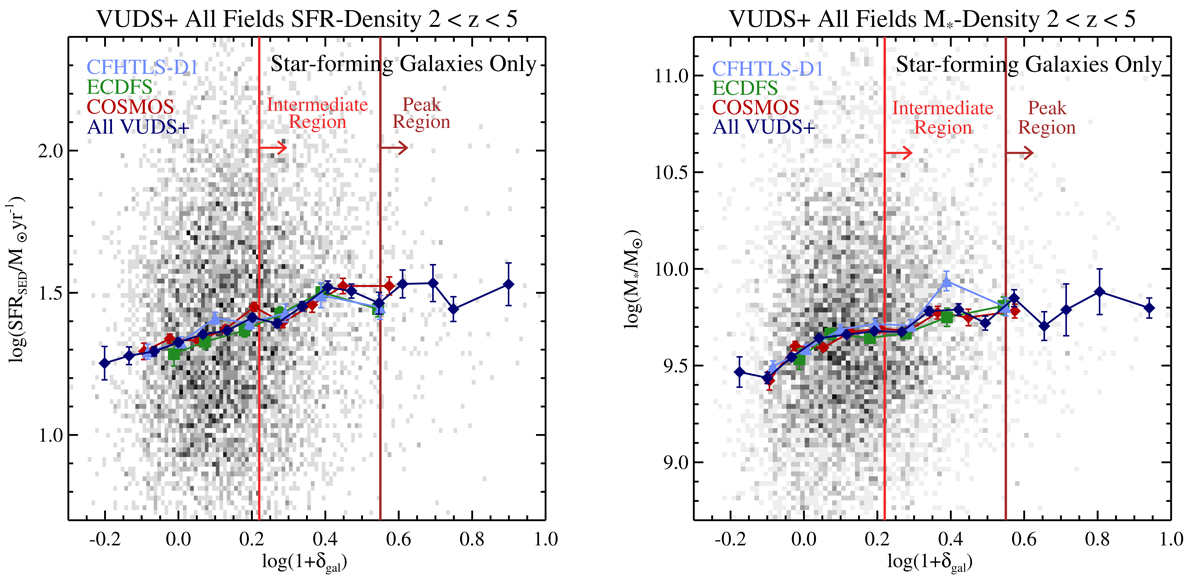
Fig. 5.
Download original image
Galaxy properties as a function of environment in the VUDS+ sample. Left: relationship between SFR and log(1 + δgal) for the 6730 galaxies in the VUDS+ spectroscopic sample. The backdrop shows the number density at a given SFR and log(1 + δgal) value for all galaxies in the sample and the light blue, green, red, and dark blue datapoints and lines show median values in each bin in log(1 + δgal) for galaxies in the CFHTLS-D1, ECDFS, COSMOS, and the full combined VUDS+ sample, respectively. Uncertainties reflect errors on the median values. The vertical dashed lines indicate the “Intermediate” and “Peak” regions of the log(1 + δgal) distributions (see Sect. 3.1), with all values lower than log(1 + δgal) = 0.22 being considered “Field" galaxies. The “All VUDS+” sample can be plotted over a larger dyanamic range in log(1 + δgal) relative to the individual field samples due to its larger sample size. A weak but highly significant positive correlation is observed (see Sect. 3.1). Right: as in the left panel, but now plotted for stellar mass (M*) and log(1 + δgal). Again, a weak but highly significant positive correlation is observed between M* and log(1 + δgal)
Current usage metrics show cumulative count of Article Views (full-text article views including HTML views, PDF and ePub downloads, according to the available data) and Abstracts Views on Vision4Press platform.
Data correspond to usage on the plateform after 2015. The current usage metrics is available 48-96 hours after online publication and is updated daily on week days.
Initial download of the metrics may take a while.