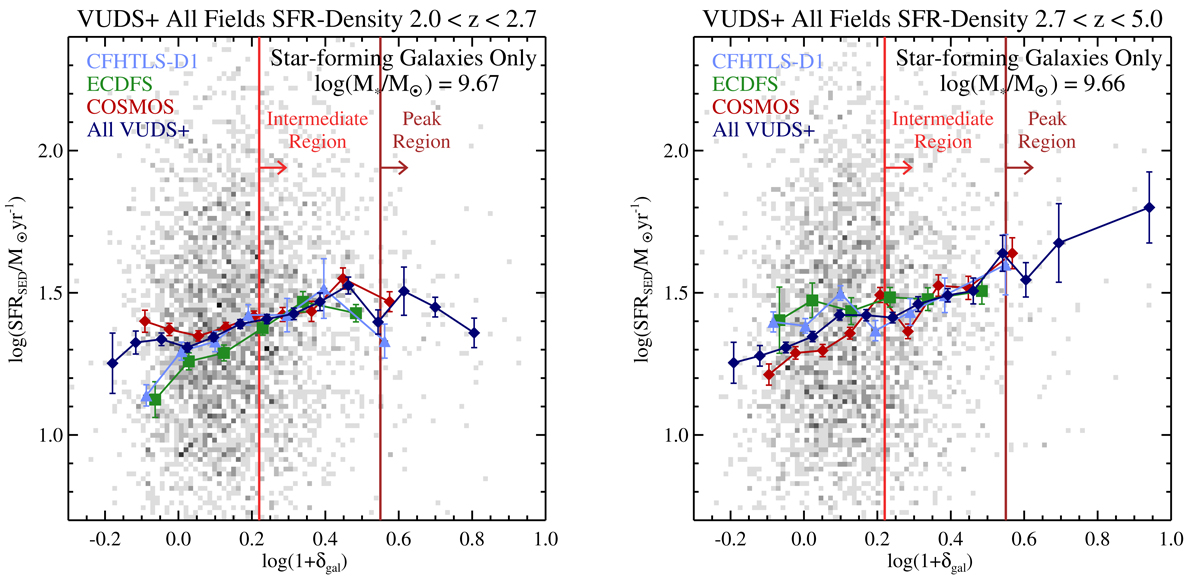
Fig. 7.
Download original image
The redshift dependence of the SFR − δgal relation in the VUDS+ sample. The two panels are identical to the left panel of Fig. 5 except now the VUDS+ sample is broken up into two redshift bins with approximately equal numbers of galaxies. The meaning of the points and their associated uncertainties are identical to those in Fig. 5 as are the meanings of the vertical lines. As in Fig. 5, the SFR − δgal for all three VUDS+ fields are shown along with the combined sample. Left panel: SFR − δgal relation for the lower-redshift sample (2.0 ≤ z ≤ 2.7) and the right panel shows the relation for the higher-redshift sample (2.7 < z ≤ 5.0). The average stellar mass of each sample is given in the top-right portion of each panel and is effectively identical between the two samples. While a significant positive correlation between SFR − δgal exists in the lower-redshift sample, this correlation disappears when considering only galaxies in the Intermediate and Peak regions. In contrast, in the higher-redshift bin, the significant positive correlation is seen at all environments and increases in strength in the densest regions.
Current usage metrics show cumulative count of Article Views (full-text article views including HTML views, PDF and ePub downloads, according to the available data) and Abstracts Views on Vision4Press platform.
Data correspond to usage on the plateform after 2015. The current usage metrics is available 48-96 hours after online publication and is updated daily on week days.
Initial download of the metrics may take a while.