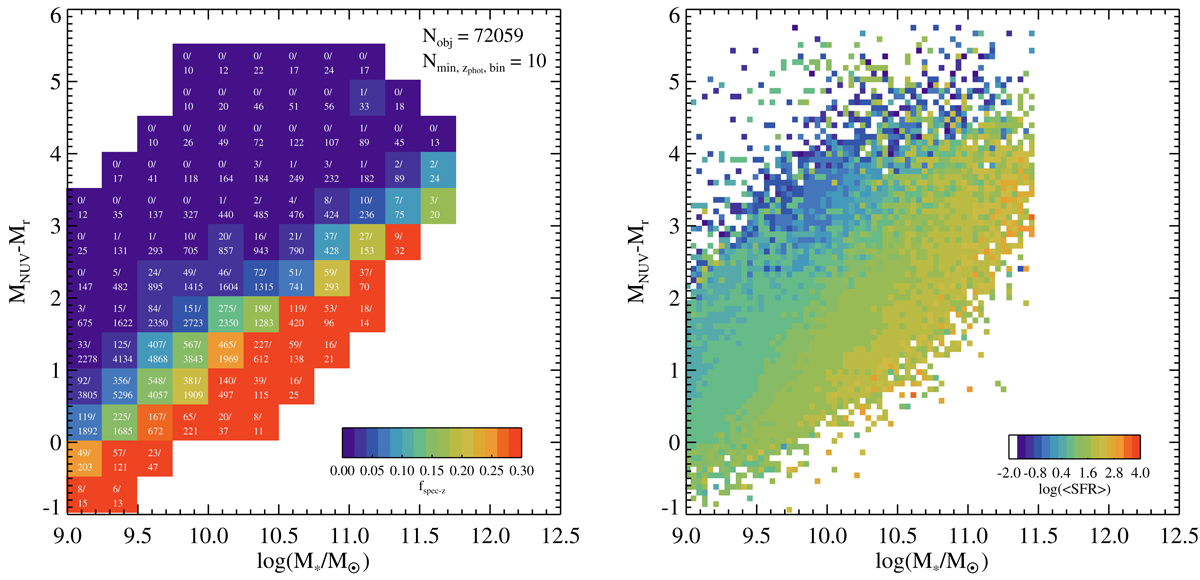
Fig. 9.
Download original image
Color, stellar mass, and SFR properties of the VUDS+ spectroscopic and parent photometric sample. Left: rest-frame color–stellar mass diagram of an observed-frame NIR-selected sample of zphot and zspec objects in across the three VUDS fields. The fraction of zphot objects with a secure spectral redshift in each color/stellar mass bin is indicated by the color bar. In each color/stellar mass bin the number of zspec and zphot objects are given by the upper and lower number in each box, respectively. Only those bins that contained ten or more zphot objects are plotted. This plot is nearly identical to the right panel of Fig. 4, but here the bins are coarser to reflect the size used to perform the weighted Monte Carlo SFR–δgal analysis presented in this section. Right: color–stellar mass diagram of the zphot sample plotted in the left panel with the color bar now corresponding to the average SED-fit SFR of all objects in that bin. No color or stellar mass limits are imposed on the galaxies plotted here, and two-dimensional bins are now plotted if they contain at least one object. The average SFR is seen to vary smoothly as a function of color and stellar mass over the range plotted. While the clear preference of the VUDS+ spectral sampling toward bluer galaxies at fixed M* appears to potentially bias the spectral sample to higher SFRs, from the analysis presented in this section we conclude that this potential bias does not drive the significant positive correlation between SFR and δgal seen in the full VUDS+ sample.
Current usage metrics show cumulative count of Article Views (full-text article views including HTML views, PDF and ePub downloads, according to the available data) and Abstracts Views on Vision4Press platform.
Data correspond to usage on the plateform after 2015. The current usage metrics is available 48-96 hours after online publication and is updated daily on week days.
Initial download of the metrics may take a while.