Free Access
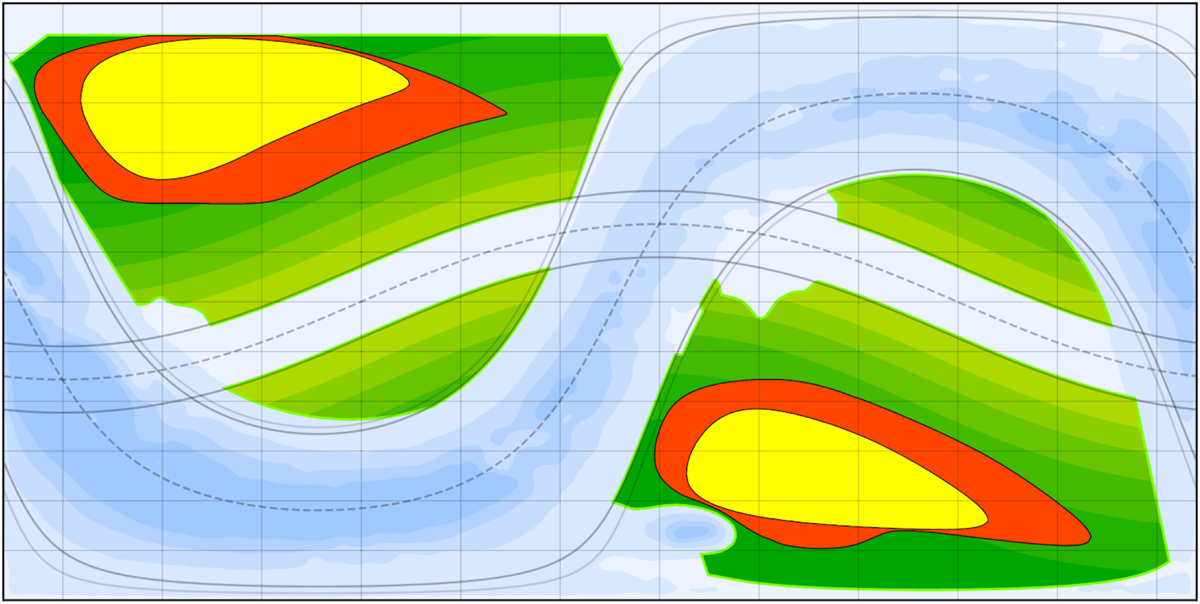
Fig. 20.
Download original image
Best S/N areas in each Galactic cap. The best 1300 deg2 in each Galactic cap is shown in yellow, and the best 2600 deg2 in red (including the yellow area). These are similar to the areas planned for the first and second data releases, 2500 deg2 and 5000 deg2, respectively (cf. Fig. 46).
Current usage metrics show cumulative count of Article Views (full-text article views including HTML views, PDF and ePub downloads, according to the available data) and Abstracts Views on Vision4Press platform.
Data correspond to usage on the plateform after 2015. The current usage metrics is available 48-96 hours after online publication and is updated daily on week days.
Initial download of the metrics may take a while.