Free Access
Fig. 32.
Download original image
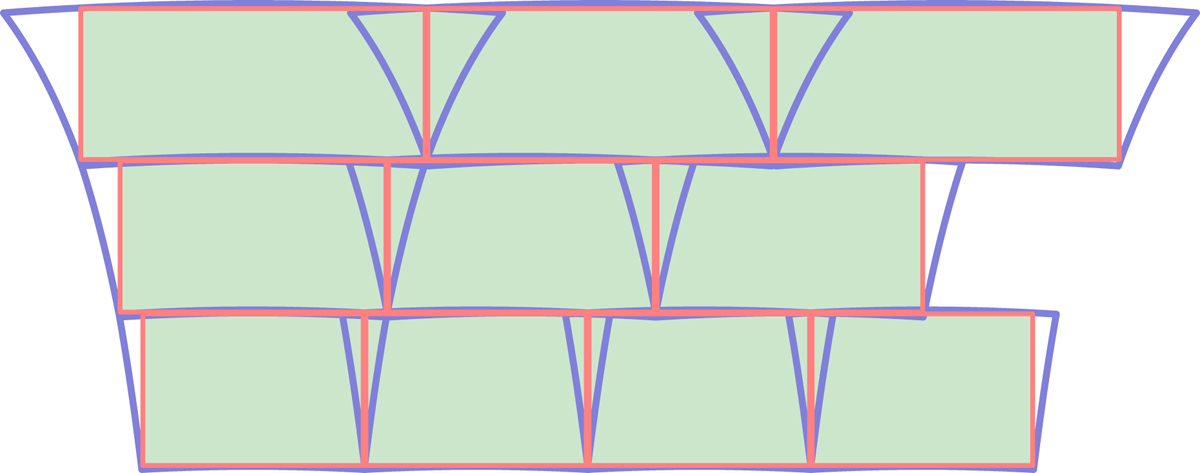
Example of a few rows of a tile-driven tessellation drawn in a cylindrical projection. Individual tiles are indicated by the red rectangles, whereas the (distorted) footprints of the FoV for non-zero latitudes are shown in blue (sizes are exaggerated for clarity). The number of tiles per row varies with latitude.
Current usage metrics show cumulative count of Article Views (full-text article views including HTML views, PDF and ePub downloads, according to the available data) and Abstracts Views on Vision4Press platform.
Data correspond to usage on the plateform after 2015. The current usage metrics is available 48-96 hours after online publication and is updated daily on week days.
Initial download of the metrics may take a while.