Fig. 39.
Download original image
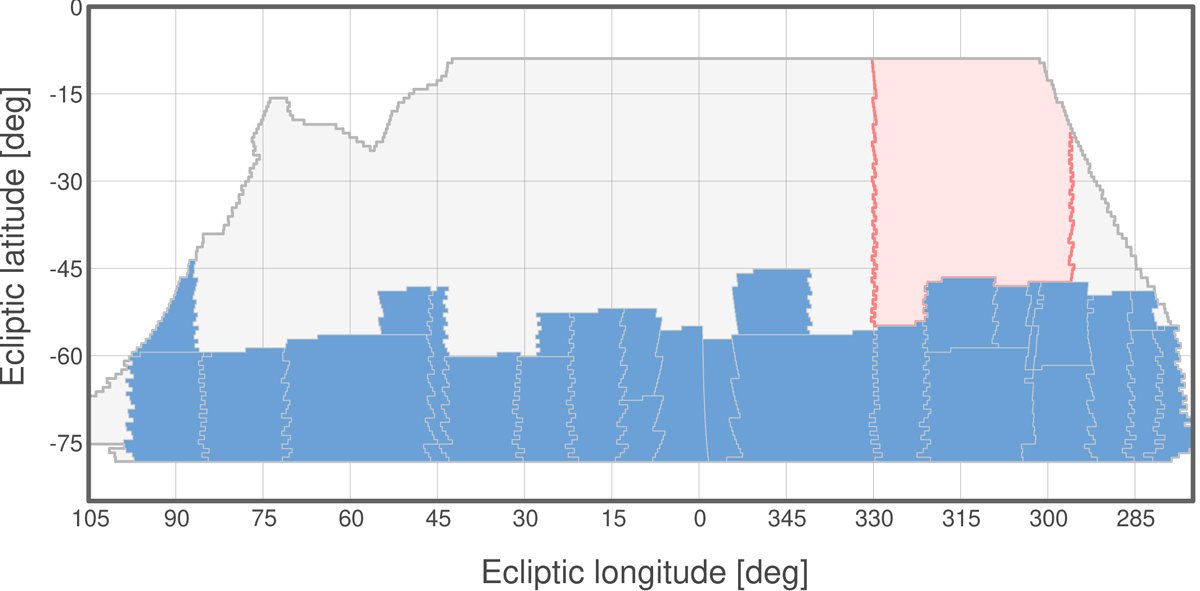
Example of a patch source reduced by previously scheduled patches (plot of region IV only, no star skipping for clarity). Previously scheduled patches are shown in blue, with the red region depicting the patch source of some windows. We notice how the bottom side of this quadrant acquired a lat-long shape after the stacking of some patches.
Current usage metrics show cumulative count of Article Views (full-text article views including HTML views, PDF and ePub downloads, according to the available data) and Abstracts Views on Vision4Press platform.
Data correspond to usage on the plateform after 2015. The current usage metrics is available 48-96 hours after online publication and is updated daily on week days.
Initial download of the metrics may take a while.