Fig. 40.
Download original image
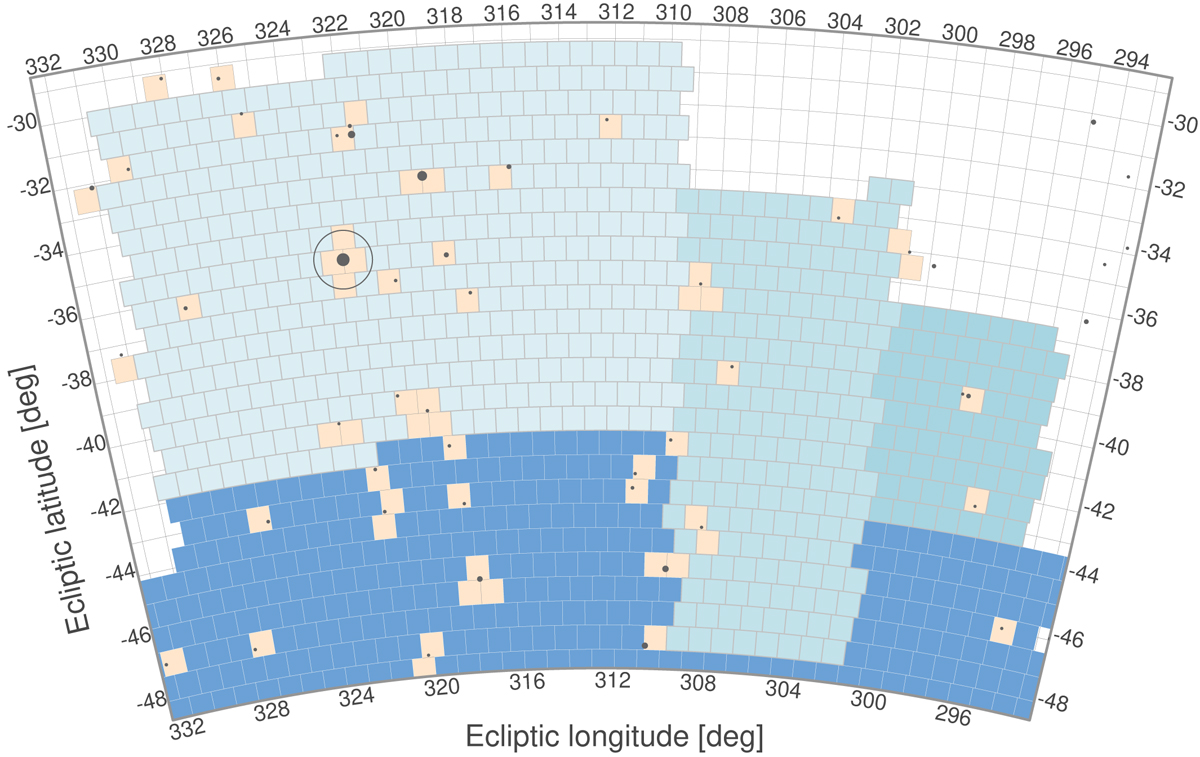
Example of sibling patch segments from a fragmented patch source (of Fig. 39). New patch segments are displayed in shades of light blue, while previously observed patches are in dark blue. The discontinuities in longitude of the previously observed patches induce the fragmentation of this patch source. Tiles containing a blinding star are excluded from the observation, here displayed in orange. Tiles in the vicinity of an extremely bright star are also excluded (even if not containing it), as is the case of the star marked with a circle at ∼(323, −36).
Current usage metrics show cumulative count of Article Views (full-text article views including HTML views, PDF and ePub downloads, according to the available data) and Abstracts Views on Vision4Press platform.
Data correspond to usage on the plateform after 2015. The current usage metrics is available 48-96 hours after online publication and is updated daily on week days.
Initial download of the metrics may take a while.