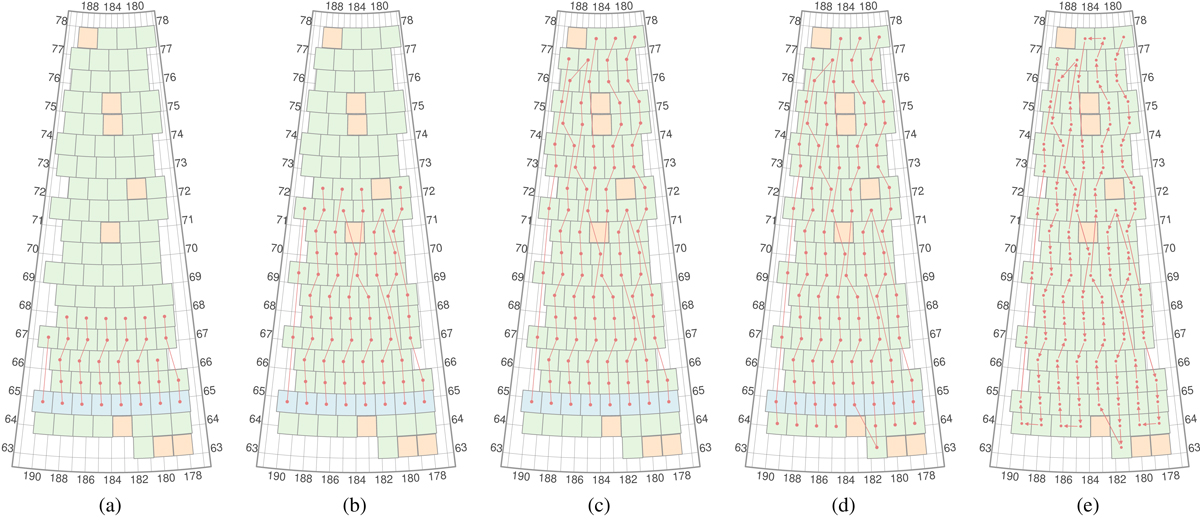
Fig. 42.
Download original image
Example run of the diffusion algorithm. The green and blue squares represent the fields in a patch. The blue ones mark the base row. The red line segments depict the progress of the algorithm as it traverses all the fields. Panel a: diffusion after fours iterations, extending the threads upwards. The remaining panels illustrate several points of the diffusion process: in panel b two threads skip across the hole left by a bright star, while two other threads merge, in panel c two threads merge while the remaining ones reach the top, in panel d the threads are extended two rows downwards, and panel e shows the final sequence, after the linking of adjacent threads. The plots are in elliptic coordinates.
Current usage metrics show cumulative count of Article Views (full-text article views including HTML views, PDF and ePub downloads, according to the available data) and Abstracts Views on Vision4Press platform.
Data correspond to usage on the plateform after 2015. The current usage metrics is available 48-96 hours after online publication and is updated daily on week days.
Initial download of the metrics may take a while.