Fig. 45.
Download original image
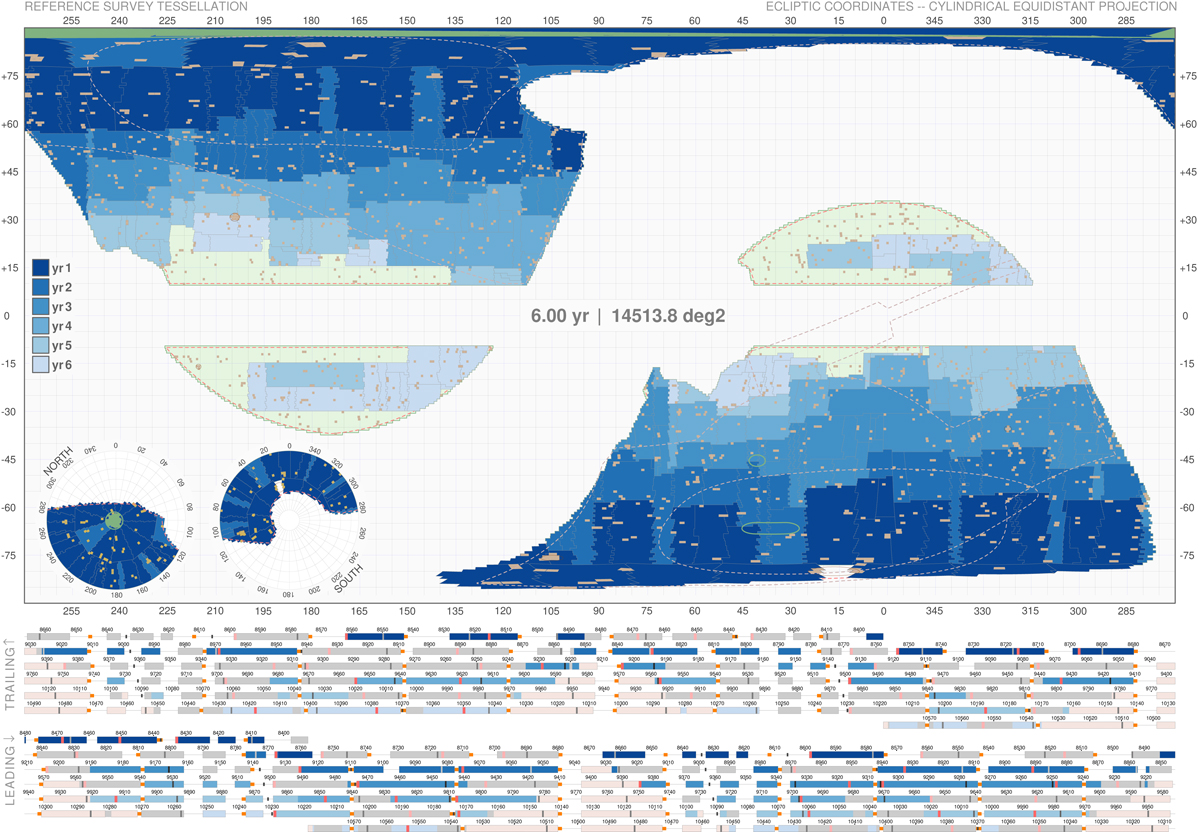
Example of the ECTile output, showing the buildup of the coverage of the EWS in RSD_2021A (cf. Sect. 8) over time in ecliptic coordinates. In the main panel the EWS patches are coloured according to different years, in correspondence to the time bars below. The part of the RoI that is not observed is in light green (we recall that the RoI covers an area larger than the one needed to be observed). Under the main panel, the progression over the six years is unfolded, with two rows for each year indicating the trailing and leading directions of the telescope. Different colours represent the progression in time, from deep blue to light blue, whereas the thin line segments represent time intervals reserved for calibrations and deep fields. The light grey boxes for the leading or trailing directions mark when the telescope is actually observing in the opposite direction (for each grey box there is a corresponding coloured box). Towards the end of the mission, some of the survey windows are completely or partially light red, showing that that particular time slot has run out of sky areas to observe.
Current usage metrics show cumulative count of Article Views (full-text article views including HTML views, PDF and ePub downloads, according to the available data) and Abstracts Views on Vision4Press platform.
Data correspond to usage on the plateform after 2015. The current usage metrics is available 48-96 hours after online publication and is updated daily on week days.
Initial download of the metrics may take a while.