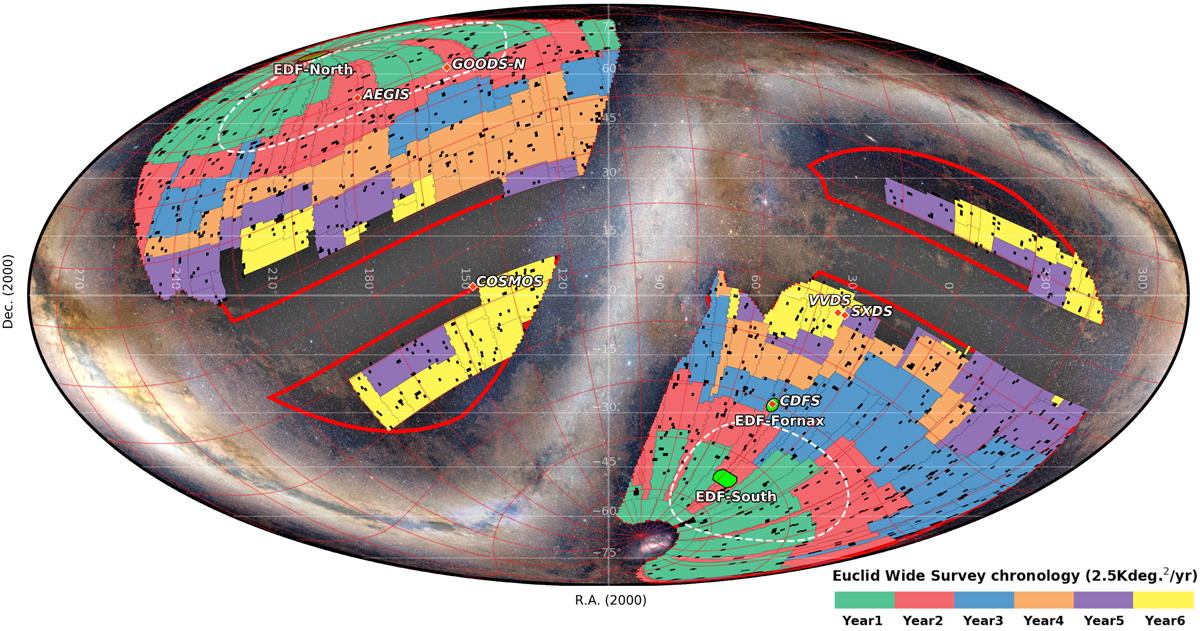
Fig. 46.
Download original image
RSD 2021A (14 514 deg2) chronology shown in celestial coordinates. RoI boundaries are shown as solid red lines. Blinding stars cause 809 avoidance areas within the reference survey, with an average of 0.785 deg2 per avoidance area, totalling 635 deg2. Dashed lines (1300 deg2 in white per Galactic cap) delimit the highest S/N areas. The ecliptic referential is over-plotted in red. The three EDFs (bright green) and the six EAFs (red diamonds, not to scale) are shown.
Current usage metrics show cumulative count of Article Views (full-text article views including HTML views, PDF and ePub downloads, according to the available data) and Abstracts Views on Vision4Press platform.
Data correspond to usage on the plateform after 2015. The current usage metrics is available 48-96 hours after online publication and is updated daily on week days.
Initial download of the metrics may take a while.