Fig. 48.
Download original image
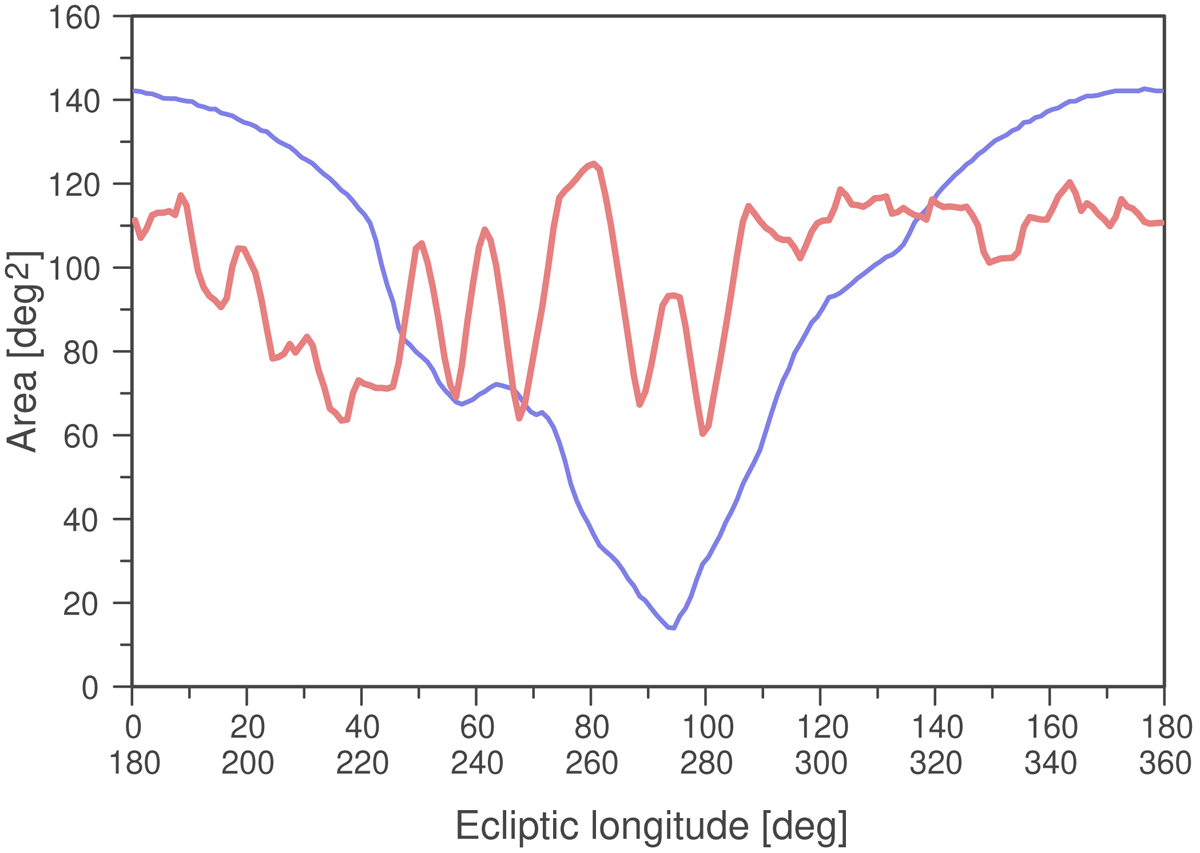
Area of the RoI as a function of (folded) longitude (blue). The equivalent area is visible as a function of (folded) longitude (red). The area is the available RoI area at transit per degree of longitude. The red curve assumes that the EWS observations are done at transit. Unallocated time arises when the red curve is above the blue curve. See text for details.
Current usage metrics show cumulative count of Article Views (full-text article views including HTML views, PDF and ePub downloads, according to the available data) and Abstracts Views on Vision4Press platform.
Data correspond to usage on the plateform after 2015. The current usage metrics is available 48-96 hours after online publication and is updated daily on week days.
Initial download of the metrics may take a while.