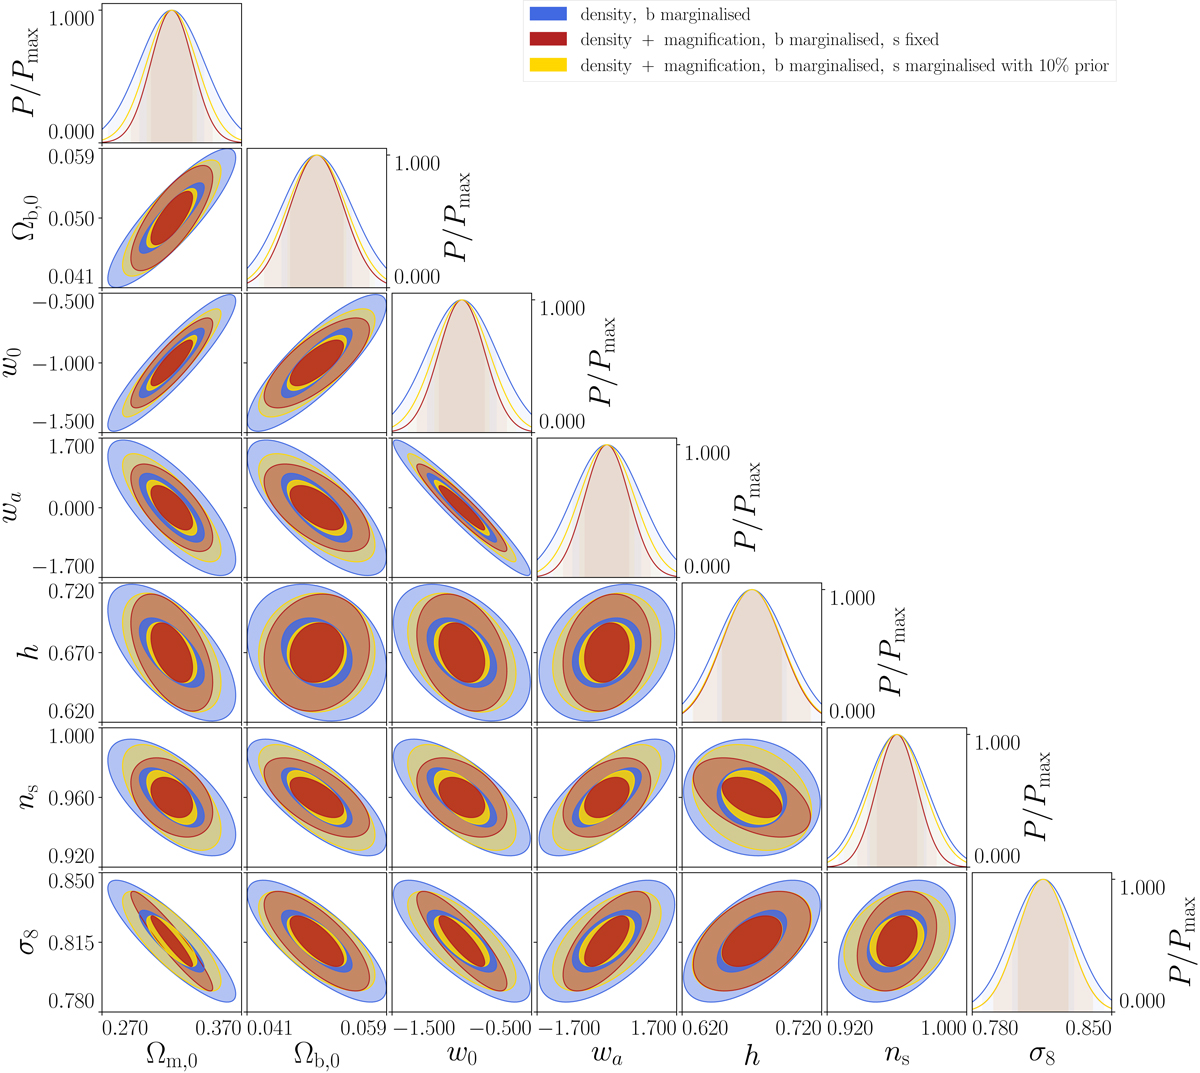
Fig. 7.
Download original image
Cosmological constraints from the GCph analysis neglecting magnification (blue contours), including magnification and assuming a perfect knowledge of the local count slope (red contours), and marginalising over the local count slope parameters with a 10% prior (yellow contours). The results reported here refer to our baseline cosmology, that is, the w0 waCDM model. The contour plot was generated using the Python library CosmicFish (Raveri et al. 2016). Dark and light contours refer to the 1σ and 2σ confidence level, respectively.
Current usage metrics show cumulative count of Article Views (full-text article views including HTML views, PDF and ePub downloads, according to the available data) and Abstracts Views on Vision4Press platform.
Data correspond to usage on the plateform after 2015. The current usage metrics is available 48-96 hours after online publication and is updated daily on week days.
Initial download of the metrics may take a while.