Fig. C.1
Download original image
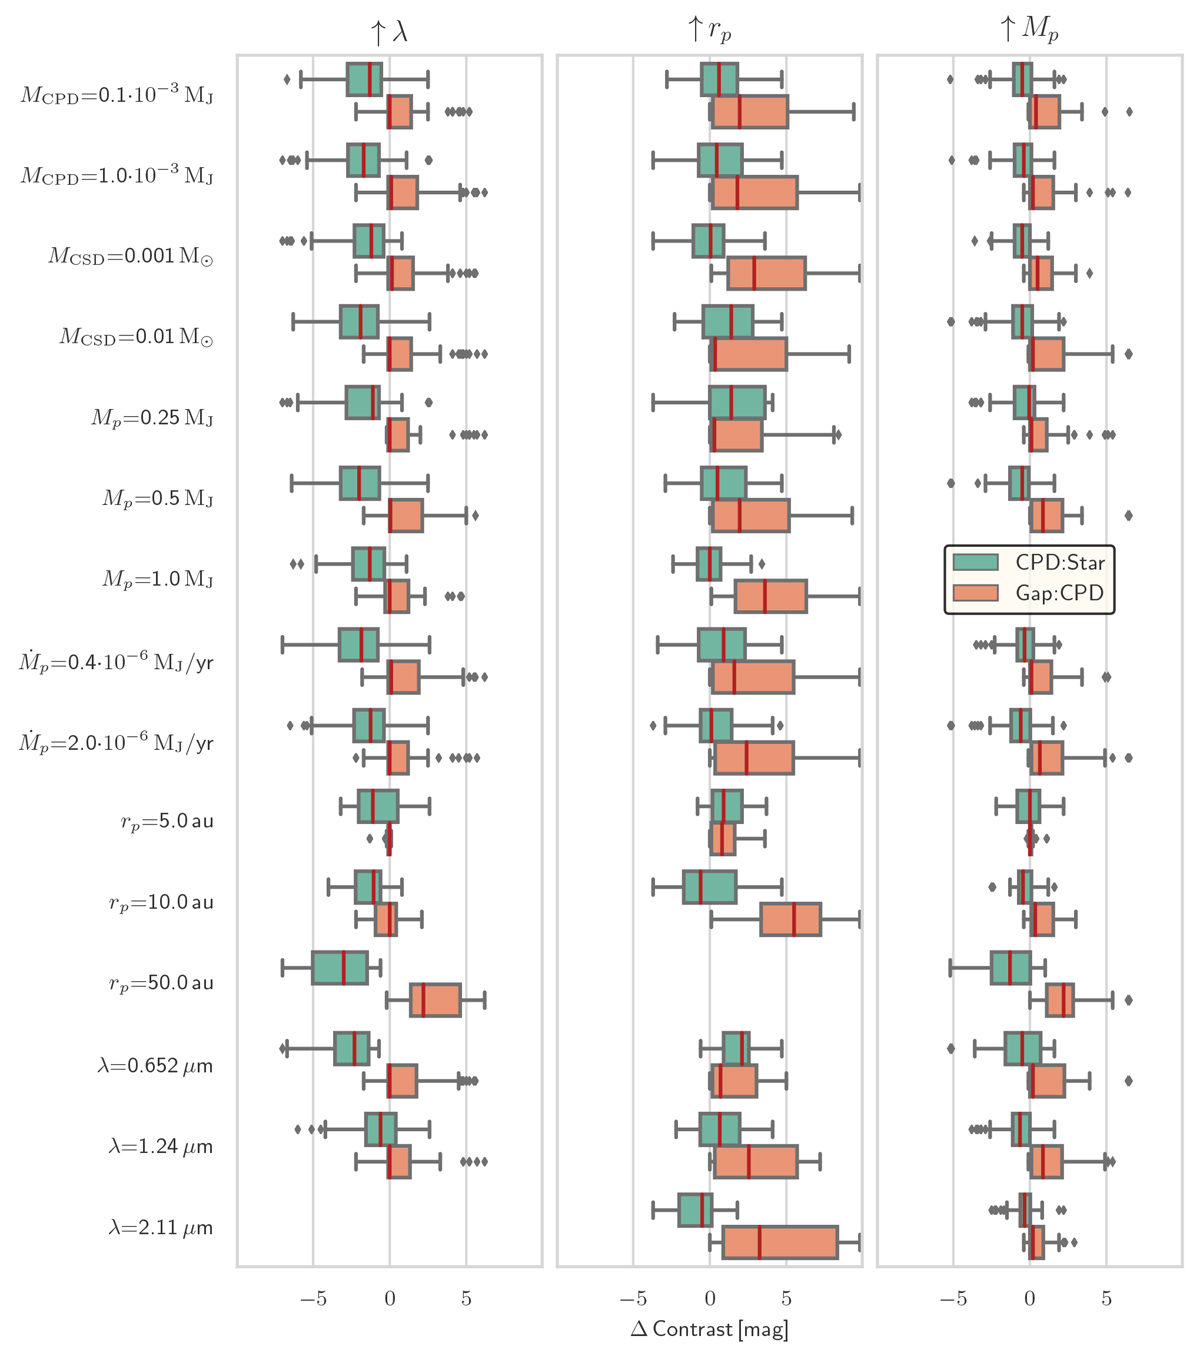
Distribution of contrast value changes in CPD : Star and Gap : CPD with respect to the change in a single model parameter using boxplots. Each median is highlighted by a red line, the middle 50% of data are represented by a box, and the maximum whisker length equals ∆w = 1.5 IQR. The labels to the left characterize the data used in generating the corresponding boxplots to the right of the label. A label refers to a shared parameter value. The label above any column refers to a parameter that has been increased to its next simulated value. Outliers are shown as black diamonds. For details, see Sect. 3.7.
Current usage metrics show cumulative count of Article Views (full-text article views including HTML views, PDF and ePub downloads, according to the available data) and Abstracts Views on Vision4Press platform.
Data correspond to usage on the plateform after 2015. The current usage metrics is available 48-96 hours after online publication and is updated daily on week days.
Initial download of the metrics may take a while.