Fig. 6
Download original image
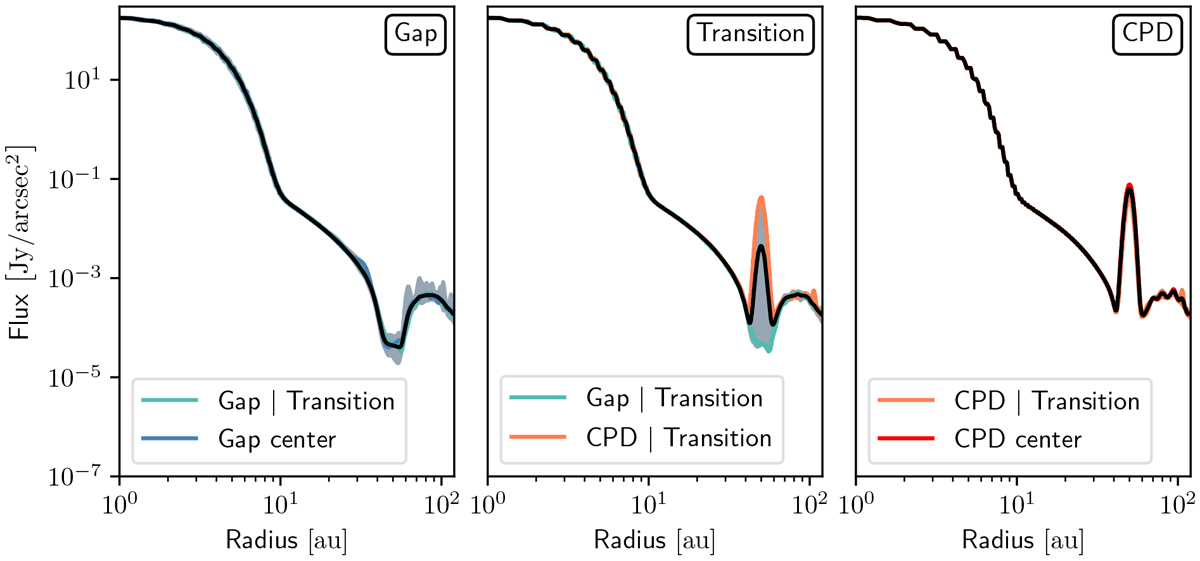
Radial profiles at λ = 1.24 µm for a model with rp = 50 au, Mp = 1 MJ, ![]() , MCPD = 0.1 × 10⁻³ MJ, and MCSD = 0.001 M⊙. The gray shaded area highlights the region in the plot where individual radial profiles of their corresponding azimuthal regions (i.e., gap, transition, or CPD) lie. The black curve in each panel is the azimuthal mean of the individual radial profiles for their corresponding azimuthal regions. For details, see Sect. 3.4.
, MCPD = 0.1 × 10⁻³ MJ, and MCSD = 0.001 M⊙. The gray shaded area highlights the region in the plot where individual radial profiles of their corresponding azimuthal regions (i.e., gap, transition, or CPD) lie. The black curve in each panel is the azimuthal mean of the individual radial profiles for their corresponding azimuthal regions. For details, see Sect. 3.4.
Current usage metrics show cumulative count of Article Views (full-text article views including HTML views, PDF and ePub downloads, according to the available data) and Abstracts Views on Vision4Press platform.
Data correspond to usage on the plateform after 2015. The current usage metrics is available 48-96 hours after online publication and is updated daily on week days.
Initial download of the metrics may take a while.