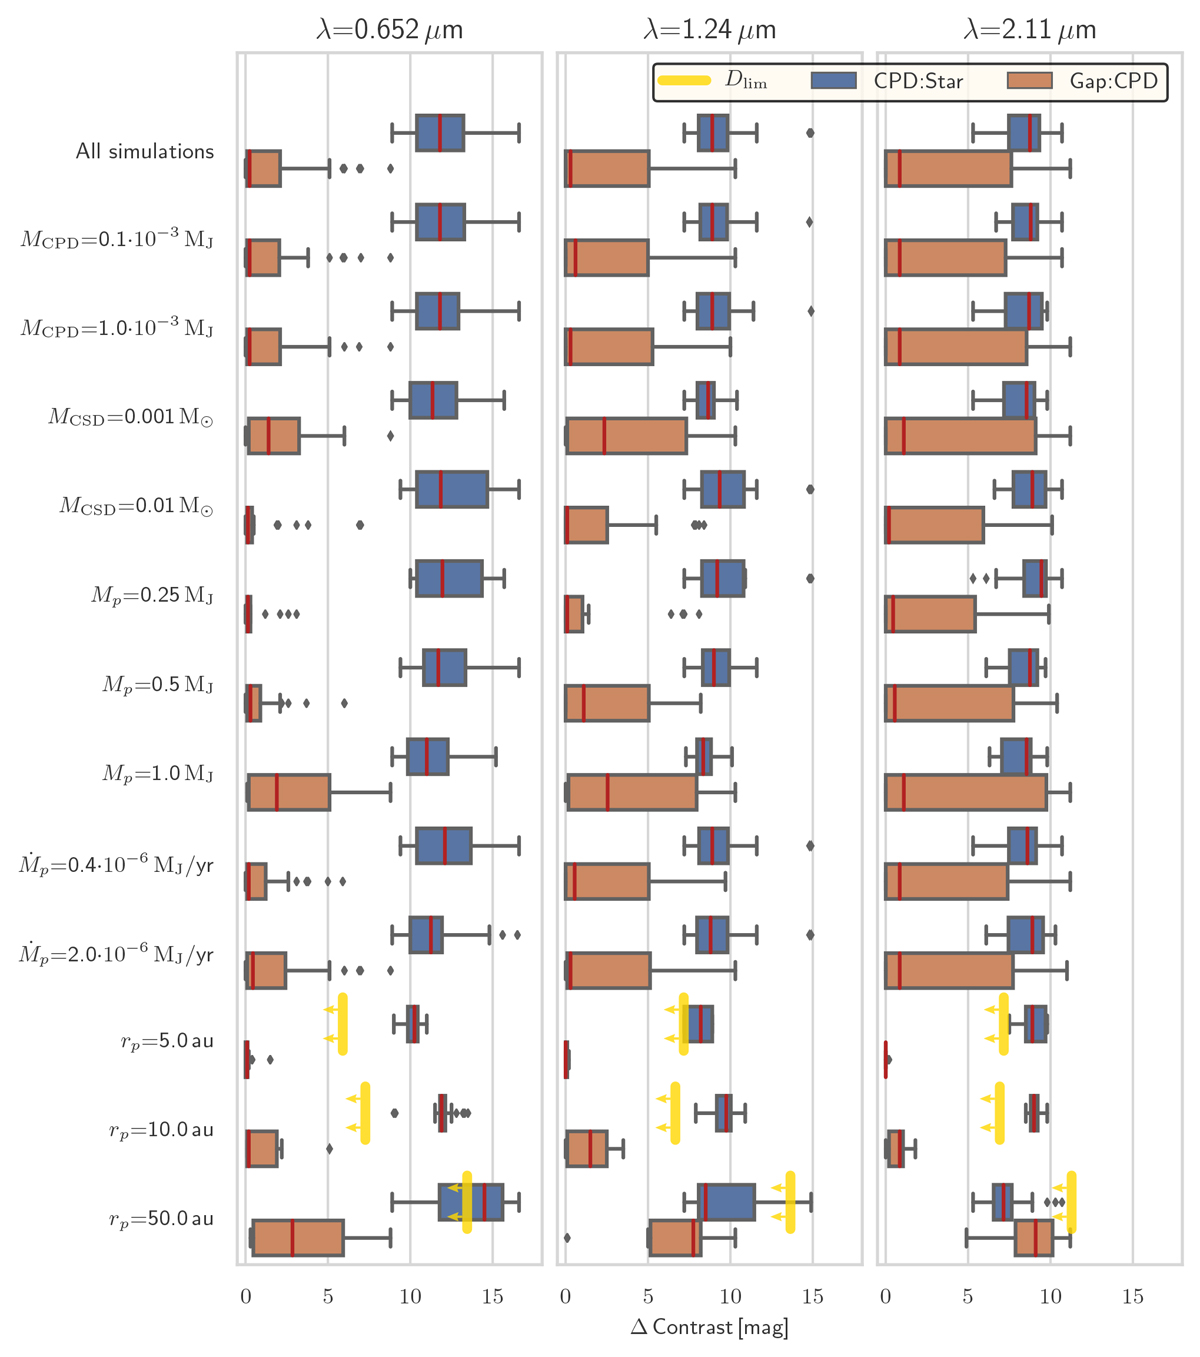
Fig. 9
Download original image
Wavelength-dependent distribution of contrast values CPD: Star and Gap: CPD shown in Tables C.2 to C.4 using boxplots. Each median is highlighted by a red line, the middle 50% of data are represented by a box, and the maximum whisker length equals Δw = 1.5IQR. The labels to the left characterize the data used in generating the corresponding boxplots to the right of the label. The label “All Simulations” in the first row refers to wavelength-dependent but otherwise unrestricted data. In any other case the label refers to a shared parameter value. The wavelength is shown above its corresponding column. The 5σ detection limits Dlim are shown as vertical yellow lines, with arrows indicating the direction of detectable signals. Outliers are shown as black diamonds. For details, see Sect. 3.6.
Current usage metrics show cumulative count of Article Views (full-text article views including HTML views, PDF and ePub downloads, according to the available data) and Abstracts Views on Vision4Press platform.
Data correspond to usage on the plateform after 2015. The current usage metrics is available 48-96 hours after online publication and is updated daily on week days.
Initial download of the metrics may take a while.