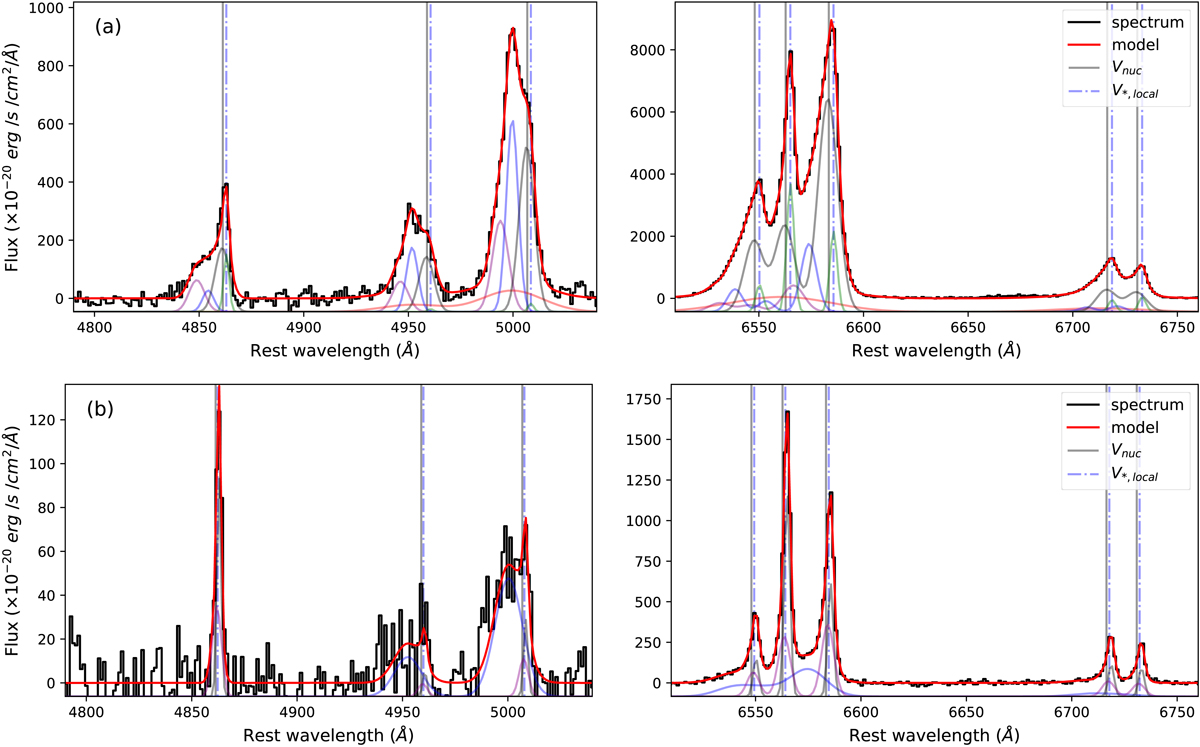
Fig. 1.
Download original image
Examples of our multi-component Gaussian fit decomposition for two continuum-subtracted spectra of I13120, extracted from single spaxels at ∼1″ (top panels) and 2″ (bottom) south-east of the nucleus. The red curves show the best-fit solutions in the Hβ–[OIII] (left) and Hα–[NII] (right) regions; all emission lines are fitted simultaneously. The vertical solid lines mark the rest-frame wavelength of the emission lines, derived from the stellar velocities of the nuclear spectrum; the vertical dot-dashed blue lines mark instead the local stellar systemic (i.e. at the position of the spaxel from which the spectrum is extracted). These examples demonstrate the diversity of emission-line profiles observed in the FoV of a single target: the spectrum in panels a is dominated by broad and blueshifted Gaussian components, while the one in panels b is dominated by bright narrow Gaussians close to the systemic velocity (for all but the [OIII] lines).
Current usage metrics show cumulative count of Article Views (full-text article views including HTML views, PDF and ePub downloads, according to the available data) and Abstracts Views on Vision4Press platform.
Data correspond to usage on the plateform after 2015. The current usage metrics is available 48-96 hours after online publication and is updated daily on week days.
Initial download of the metrics may take a while.