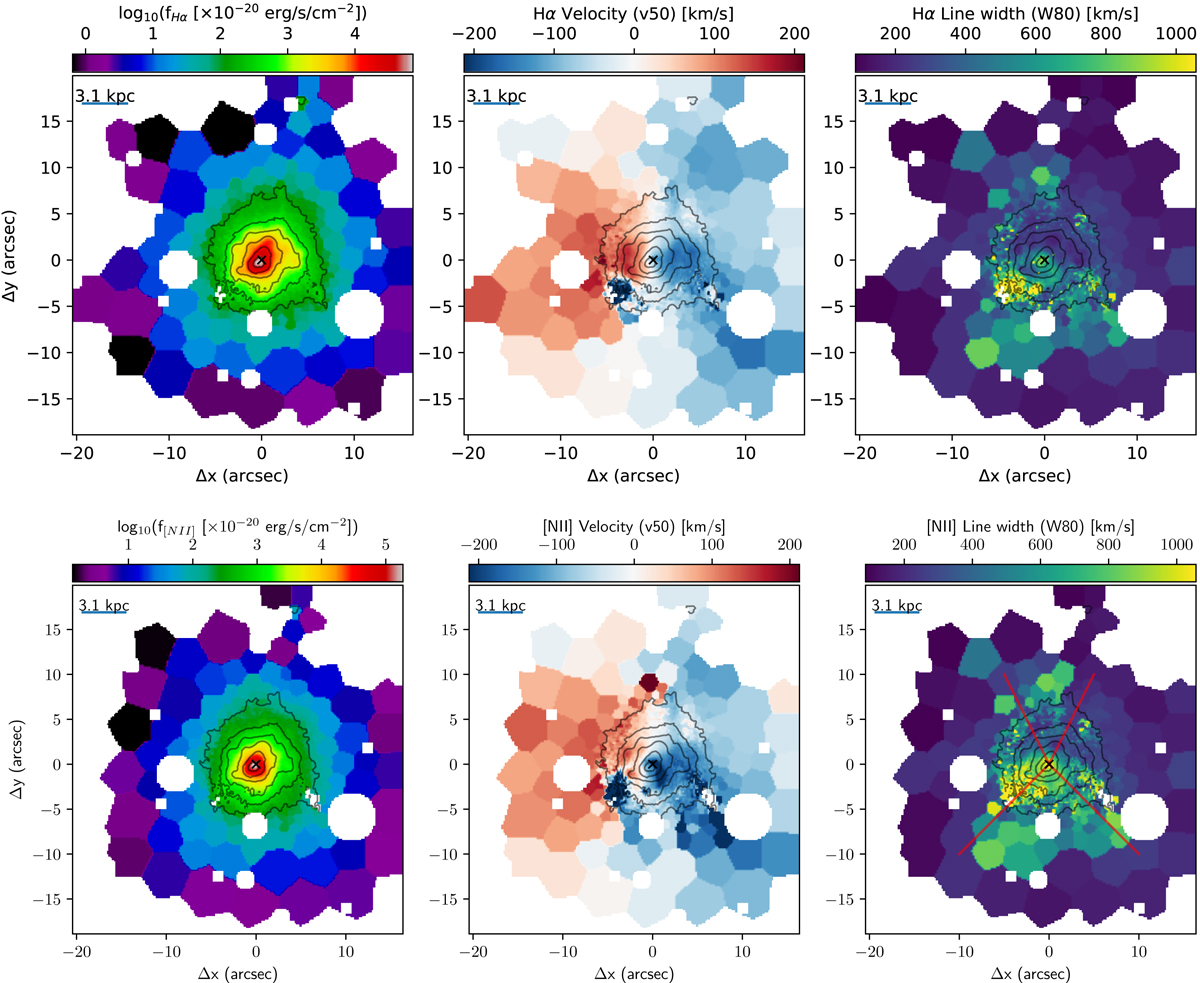
Fig. 2.
Download original image
I13120 maps. Top: total Hα integrated flux (left), Hα centroid (v50, centre), and line width (W80, right) obtained from the multi-component Gaussian fit. Bottom: similar panels for [NII]; in the W80 map, the red lines indicate the wide biconical outflow along the north-south direction. Masked regions mark the spaxels contaminated by the presence of background and foreground sources and excluded as disturbing the data analysis. The first solid contour is 3σ, and the jump is 0.5 dex. The cross marks the nucleus. North is up, and west is to the right.
Current usage metrics show cumulative count of Article Views (full-text article views including HTML views, PDF and ePub downloads, according to the available data) and Abstracts Views on Vision4Press platform.
Data correspond to usage on the plateform after 2015. The current usage metrics is available 48-96 hours after online publication and is updated daily on week days.
Initial download of the metrics may take a while.