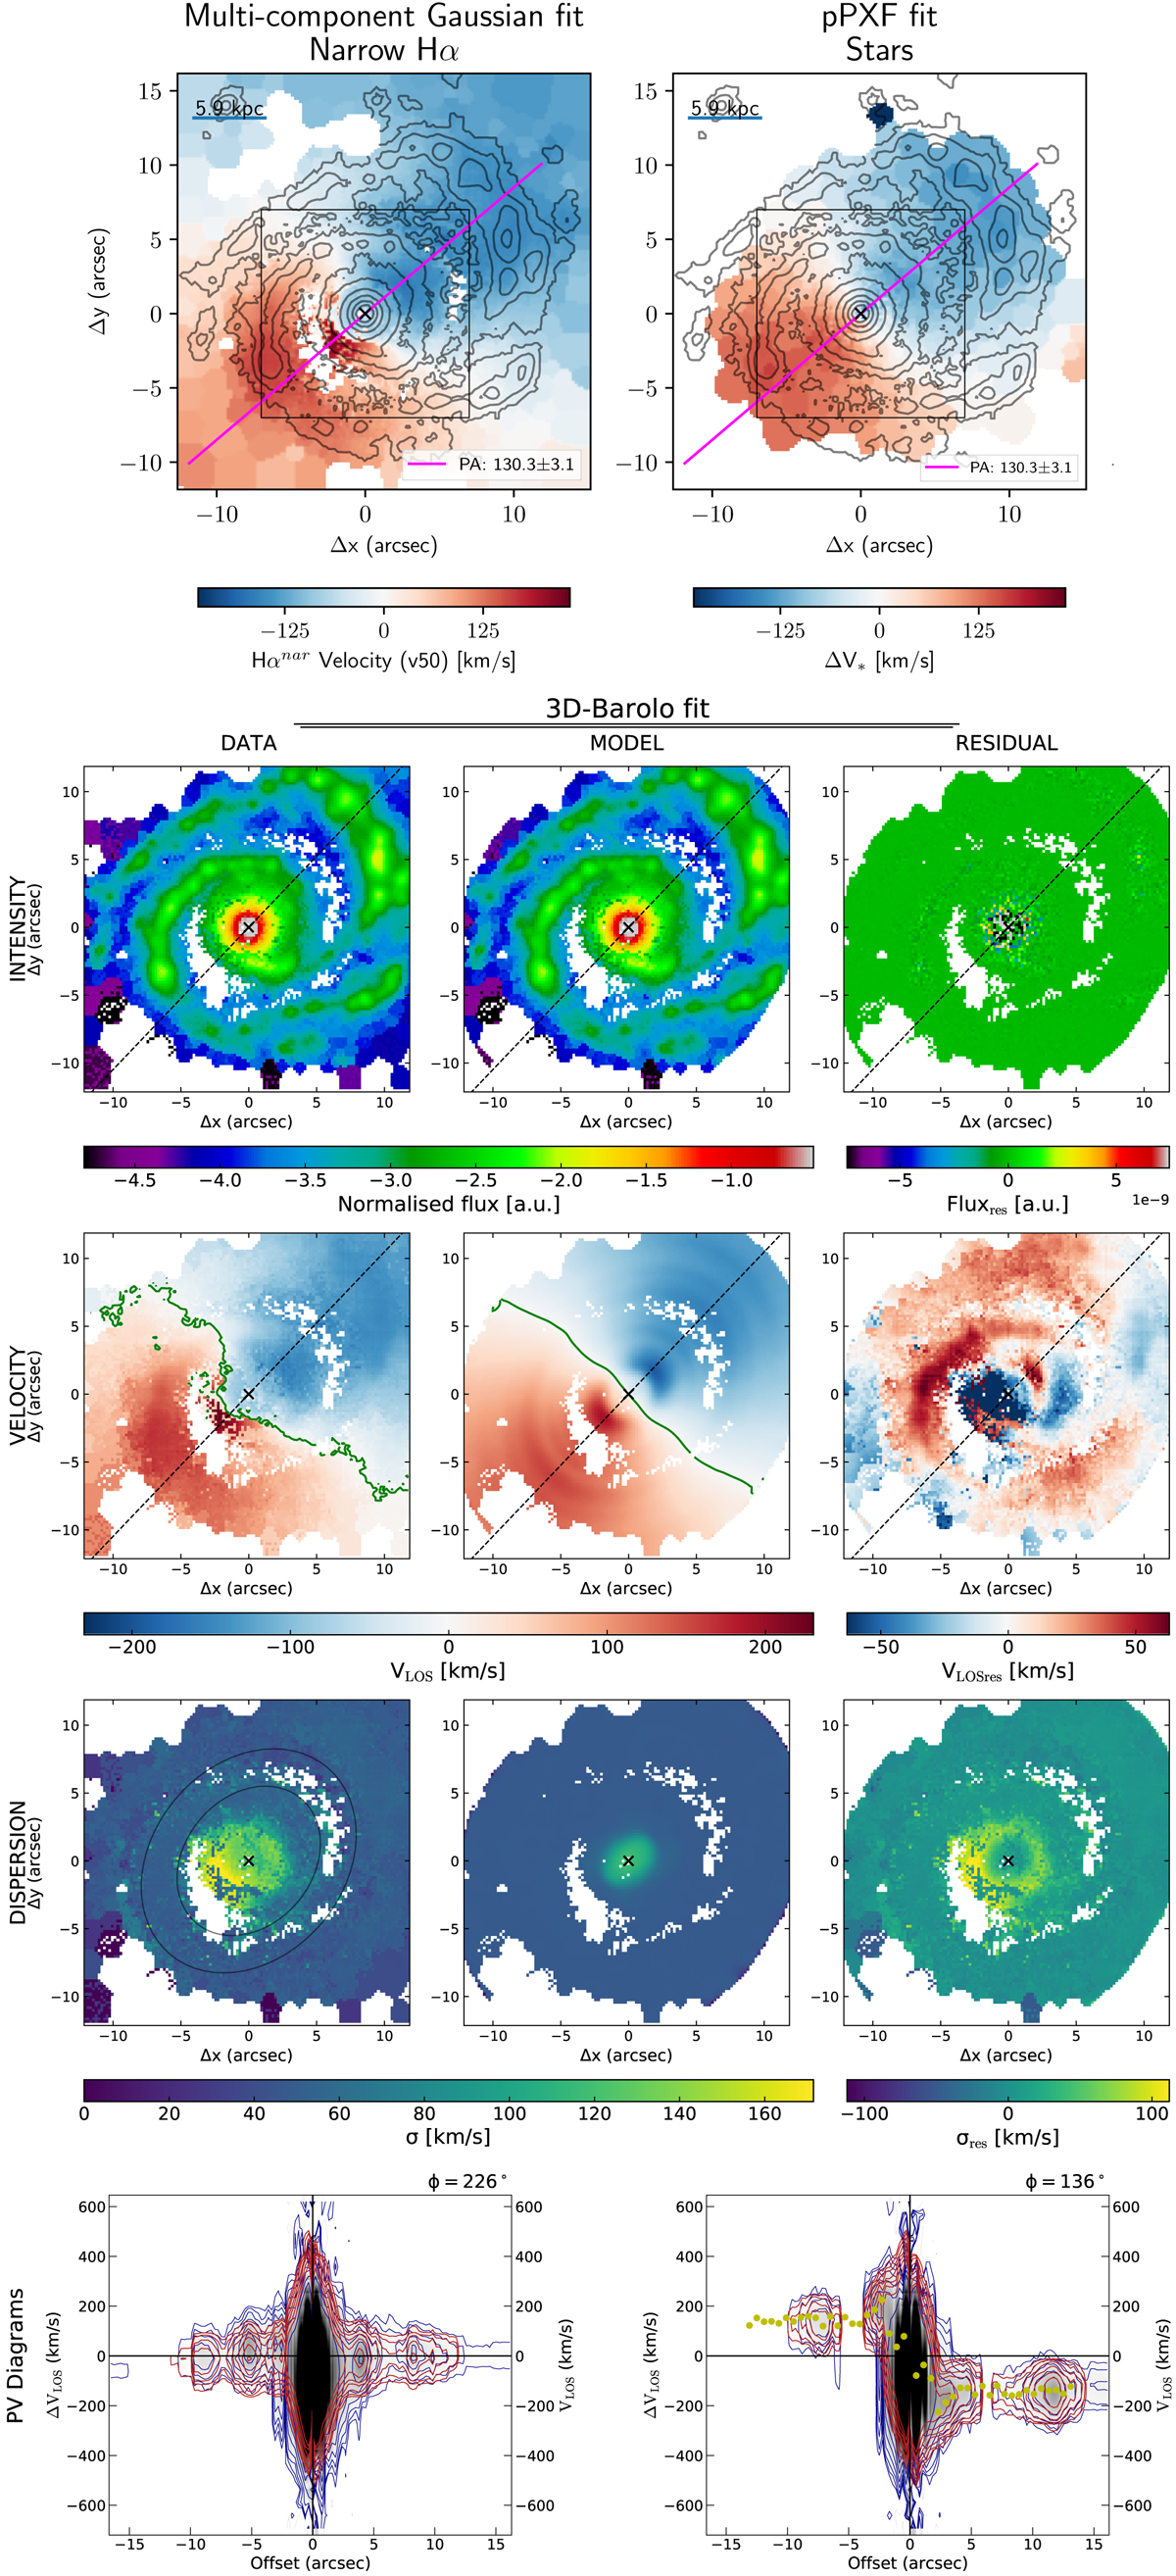
Fig. C.1.
Download original image
IZw1 velocity maps and the 3D-Barolo disk kinematic best fit. Top panels: Narrow Hα (left) and pPXF stellar (right) velocity maps. The magenta line identifies the major axis PA measurement, computed within the black box region; the black cross identifies the nucleus. Second to fourth row panels: Comparison of 3D-Barolo data and model moment maps, as labelled in the figure. In the intensity and velocity maps, we report the major axis PA (dashed line) and the position of the kinematic centre (black cross); the green curves in the velocity maps represent the zero-velocity axis. In the dispersion map on the left, the black curves show the region from which the median σ0 value has been derived. Bottom panels: PV diagram along the major axis (right) and minor axis (left) for both the data (grey map and blue contours) and the best-fit model (red contours; the yellow dots associated with individual concentric rings are used to model the data).
Current usage metrics show cumulative count of Article Views (full-text article views including HTML views, PDF and ePub downloads, according to the available data) and Abstracts Views on Vision4Press platform.
Data correspond to usage on the plateform after 2015. The current usage metrics is available 48-96 hours after online publication and is updated daily on week days.
Initial download of the metrics may take a while.