Fig. 3.
Download original image
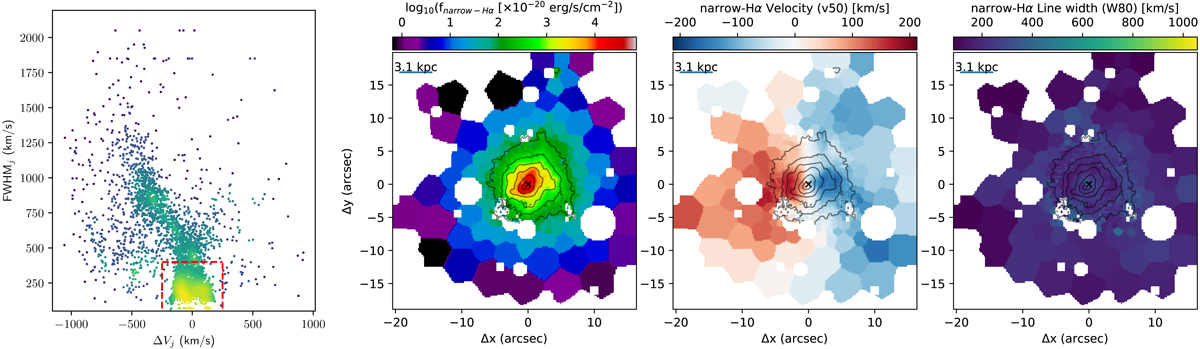
I13120 velocity diagram and maps. Left panel: I13120 velocity shift ΔVj − FWHMj diagram (coloured by density in log-scale) for the individual Gaussian components used to model the emission line profiles in the data cube. The dashed red lines isolate the Gaussian components used to reconstruct the narrow Hα data cube, with |ΔVj|< 250 km s−1 and FWHMj < 400 km s−1. Right panels: narrow Hα flux distribution, velocity (v50), and line width (W80) maps, reported in the second, third, and fourth panels, respectively (see Fig. 2 for details).
Current usage metrics show cumulative count of Article Views (full-text article views including HTML views, PDF and ePub downloads, according to the available data) and Abstracts Views on Vision4Press platform.
Data correspond to usage on the plateform after 2015. The current usage metrics is available 48-96 hours after online publication and is updated daily on week days.
Initial download of the metrics may take a while.