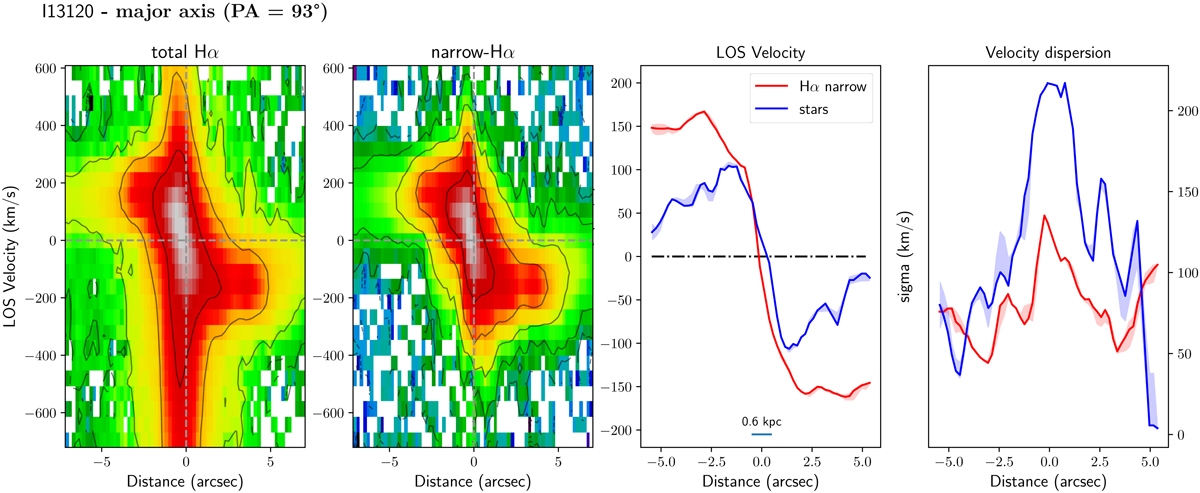
Fig. 4.
Download original image
I13120 PV diagrams along the galaxy major axis. Left two panels: PV maps of the total Hα and the narrow Hα emission. Right panels: extracted line velocity centroids and line width of the narrow Hα, as well as the stellar velocities along the same axis. 1″ corresponds to ∼0.6 kpc at the distance of I13120, as labelled in the third panel.
Current usage metrics show cumulative count of Article Views (full-text article views including HTML views, PDF and ePub downloads, according to the available data) and Abstracts Views on Vision4Press platform.
Data correspond to usage on the plateform after 2015. The current usage metrics is available 48-96 hours after online publication and is updated daily on week days.
Initial download of the metrics may take a while.