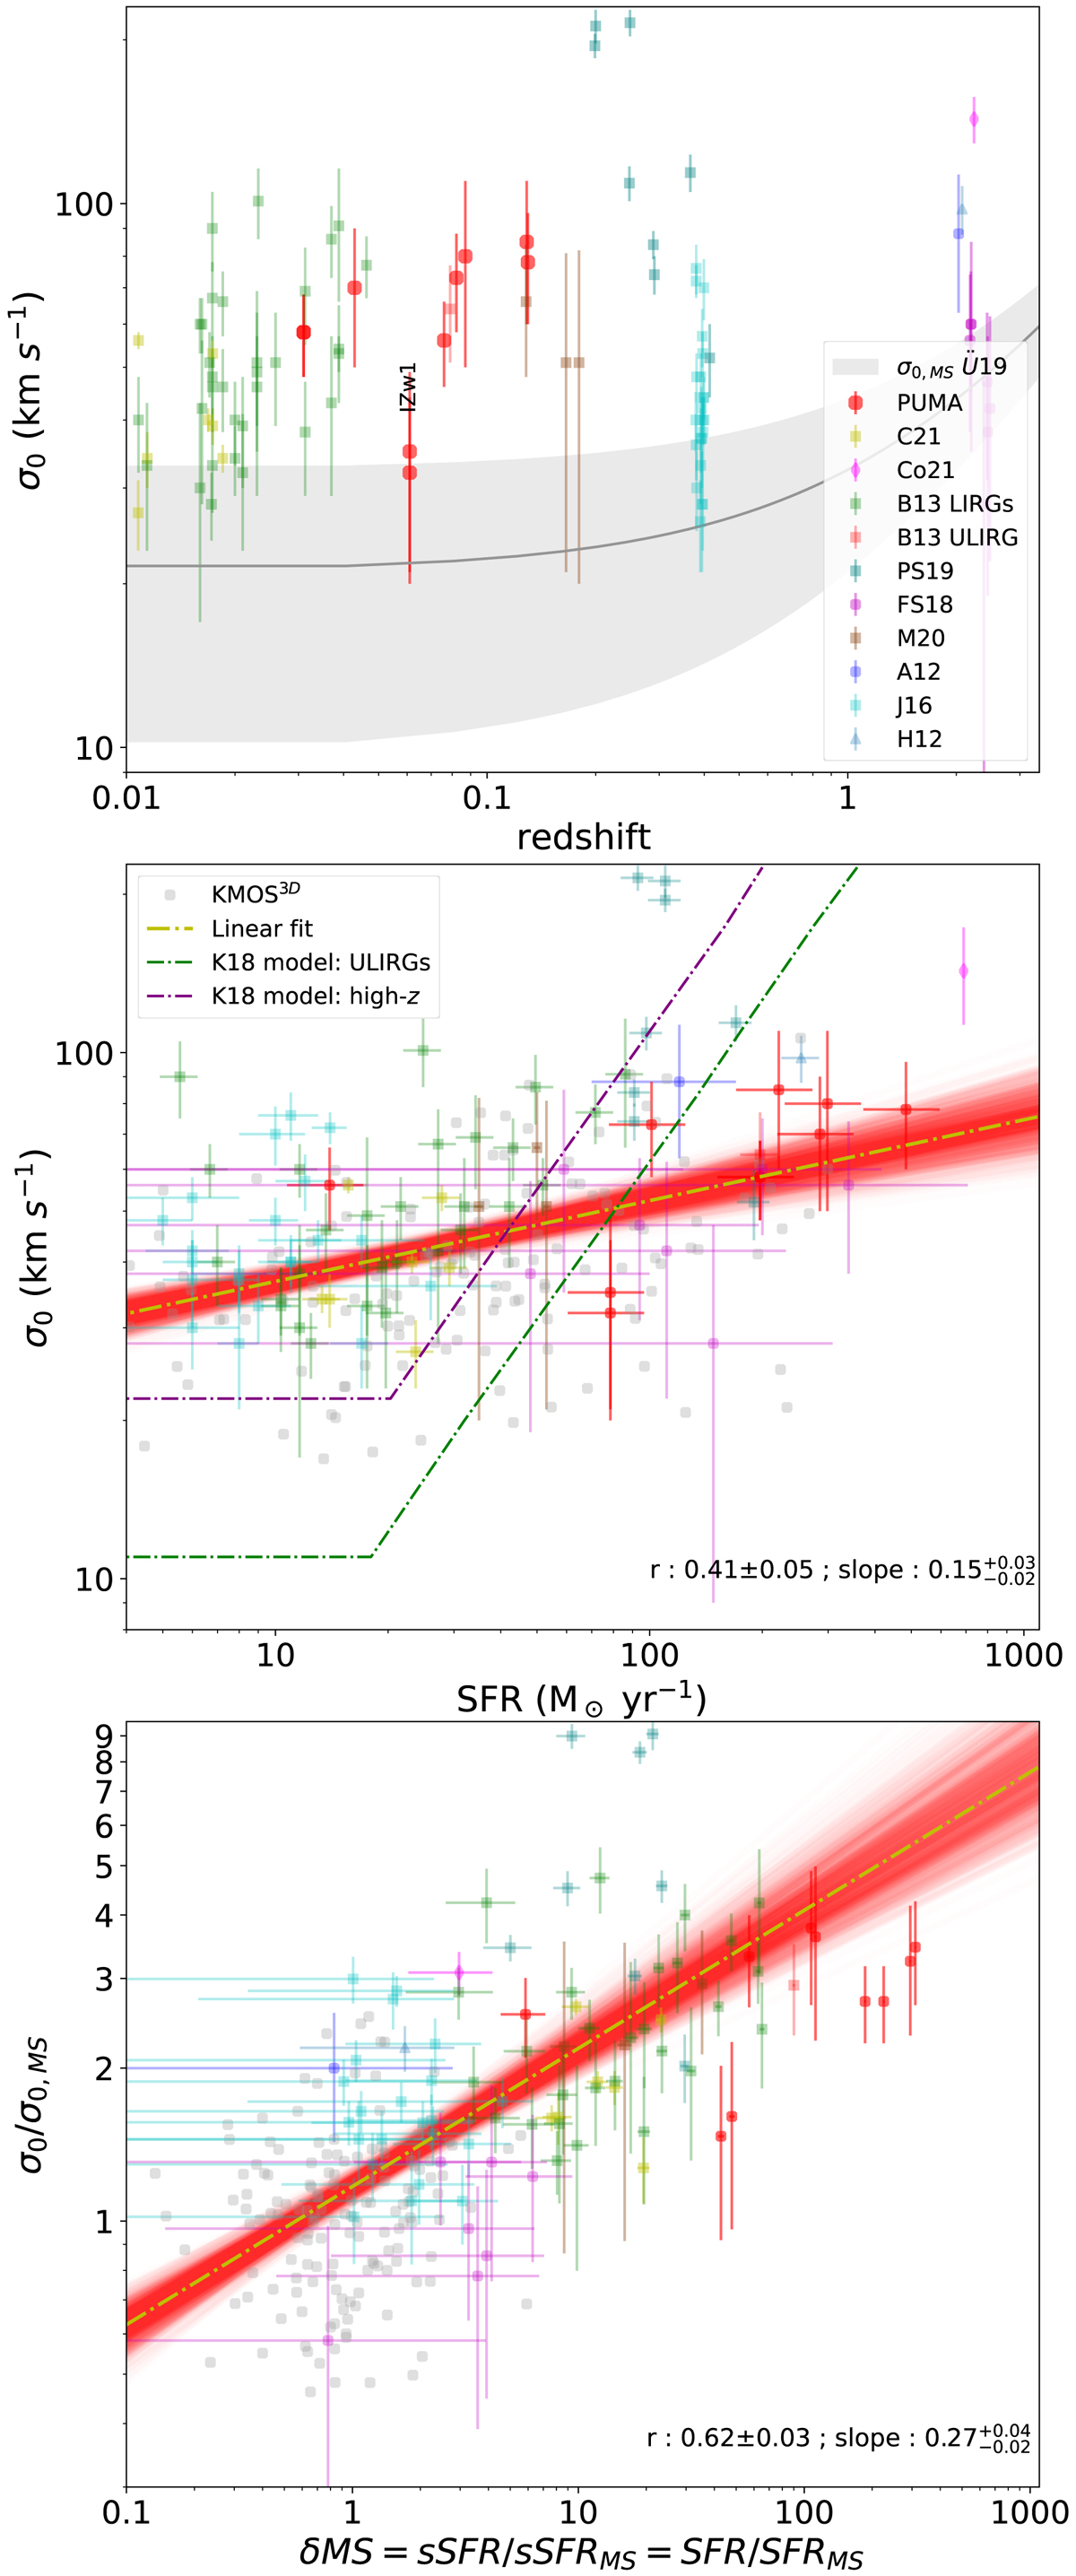
Fig. 7.
Download original image
Gas velocity dispersion σ0 evolutionary trend and correlations. Top: velocity dispersion, σ0, as a function of z for the PUMA sub-sample (red dots) and other individual ionised gas measurements from the literature, distinguishing between the different samples presented in Appendix D, as labelled. The Übler et al. (2019) evolutionary trend of MS galaxies is shown with a solid curve (shaded area: 1σ scatter around the average trend). Middle: σ0 as a function of the SFR for all targets already reported in the first panel and the KMOS3D galaxies (grey points; Übler et al. 2019). K18 models and a linear fit (with scatter) are also reported, as labelled. Bottom: σ0 normalised to the evolutionary trend of MS galaxies as a function of δMS for all targets already reported above. A linear fit is also reported.
Current usage metrics show cumulative count of Article Views (full-text article views including HTML views, PDF and ePub downloads, according to the available data) and Abstracts Views on Vision4Press platform.
Data correspond to usage on the plateform after 2015. The current usage metrics is available 48-96 hours after online publication and is updated daily on week days.
Initial download of the metrics may take a while.