Free Access
Fig. A.1.
Download original image
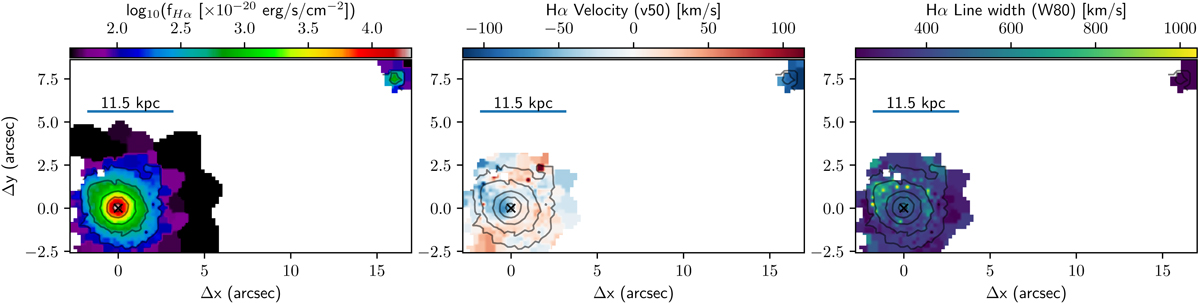
I00188 maps: Hα integrated flux (left), Hα centroid (v50, centre), and line width (W80, right) obtained from the multi-component Gaussian fit. The first solid contour is 3σ, and the jump is 0.5 dex. The cross marks the nucleus. North is up, and west is to the right.
Current usage metrics show cumulative count of Article Views (full-text article views including HTML views, PDF and ePub downloads, according to the available data) and Abstracts Views on Vision4Press platform.
Data correspond to usage on the plateform after 2015. The current usage metrics is available 48-96 hours after online publication and is updated daily on week days.
Initial download of the metrics may take a while.