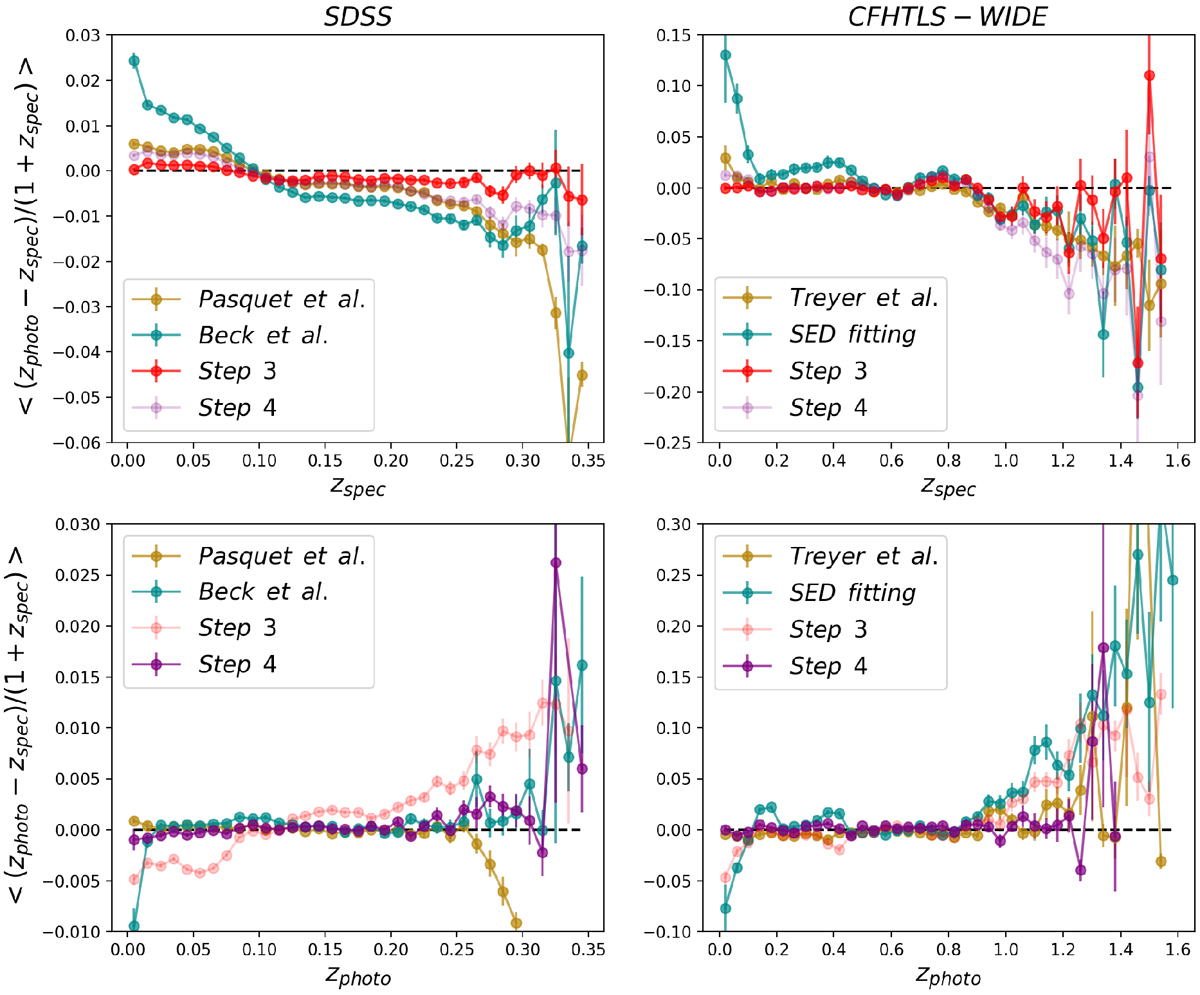
Fig. 12
Download original image
Mean residuals as a function of spectroscopic or photometric redshift with the SDSS data and the CFHTLS-WIDE data. The results from steps 3 and 4 of our methods with the network Net_P are compared with those produced by data-driven methods from Pasquet et al. (2019), Beck et al. (2016), Treyer et al. (in prep.), and SED fitting using the Le Phare code (Arnouts et al. 1999; Ilbert et al. 2006). The results from step 3 (step 4) are plotted in light red (purple) for comparison in the lower (upper) panels. Steps 1-3 are applied in advance of the calibration by step 4. For consistency with our test samples, 103 305 SdSs galaxies and 10000 CFHTLS-WIDE galaxies in the given redshift ranges are selected from these studies for the plot. We note that we take zmode (i.e., the redshift at the peak probability) as the point estimates of photometric redshifts, whereas Pasquet et al. (2019) took zmean (i.e., the probability-weighted mean redshift) and Treyer et al. (in prep.) took zmed¡an (i.e., the median redshift drawn from the probability distribution).
Current usage metrics show cumulative count of Article Views (full-text article views including HTML views, PDF and ePub downloads, according to the available data) and Abstracts Views on Vision4Press platform.
Data correspond to usage on the plateform after 2015. The current usage metrics is available 48-96 hours after online publication and is updated daily on week days.
Initial download of the metrics may take a while.