Fig. D.1
Download original image
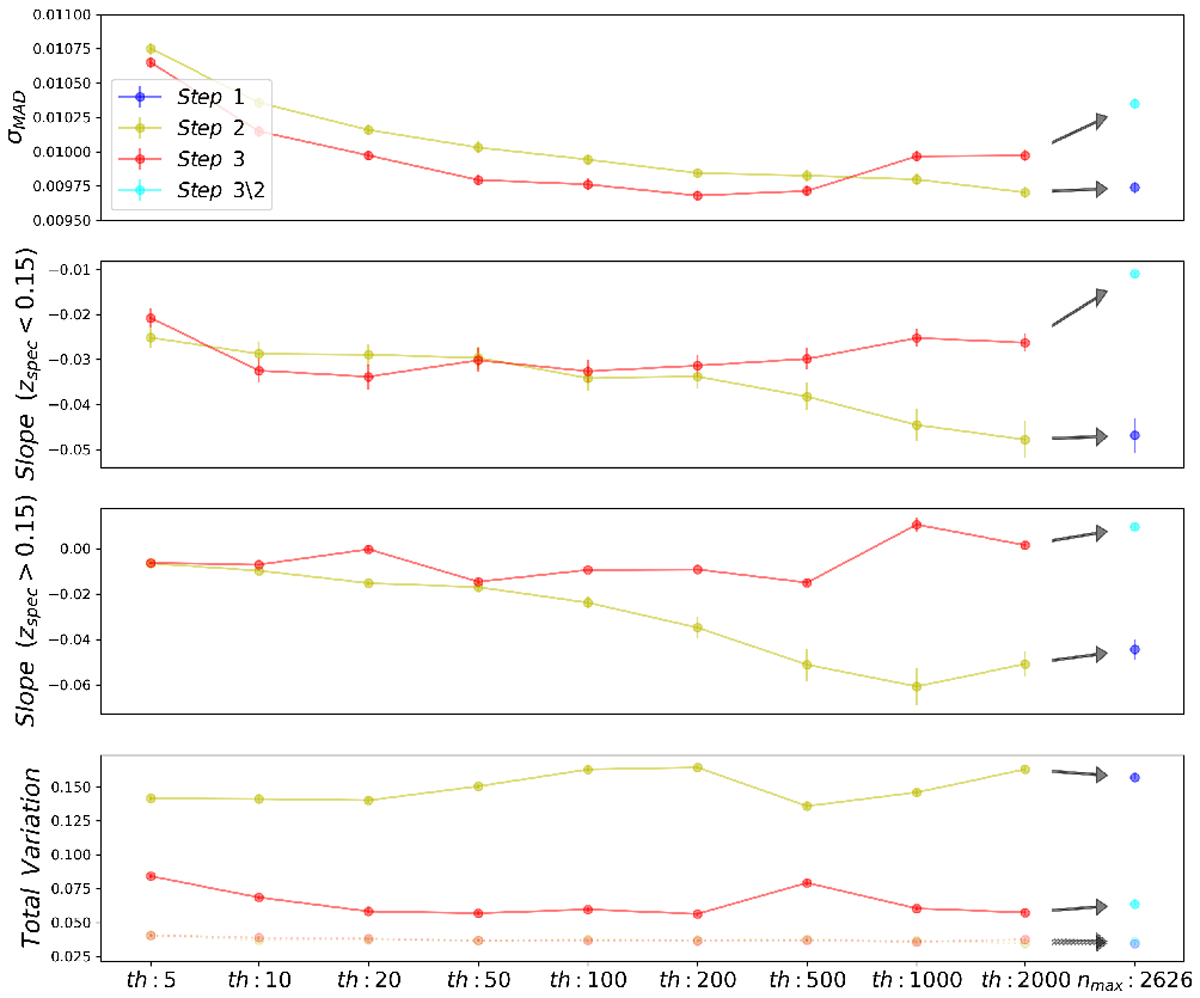
σMAD (Eq. 11), the slopes of the < Δz > − zSPec piecewise linear fit (Eq. 9) and the total variation distance between the zPh0t0 and zSPec sample distributions (Eq. 10) as a function of the balancing threshold that defines the nearly balanced training subset for steps 2 and 3 of our methods. As the threshold approaches the maximum number density (2,626 in this case), the results from step 2 are expected to converge to those from step 1, and those from step 3 are expected to converge to those from step 3\2 in which step 2 is skipped. The dotted curves show the total variation distances for the simulated zphoto sample distributions that are expected to have no mode collapse. We compare the methods using the SDSS data and the network Net_P.
Current usage metrics show cumulative count of Article Views (full-text article views including HTML views, PDF and ePub downloads, according to the available data) and Abstracts Views on Vision4Press platform.
Data correspond to usage on the plateform after 2015. The current usage metrics is available 48-96 hours after online publication and is updated daily on week days.
Initial download of the metrics may take a while.