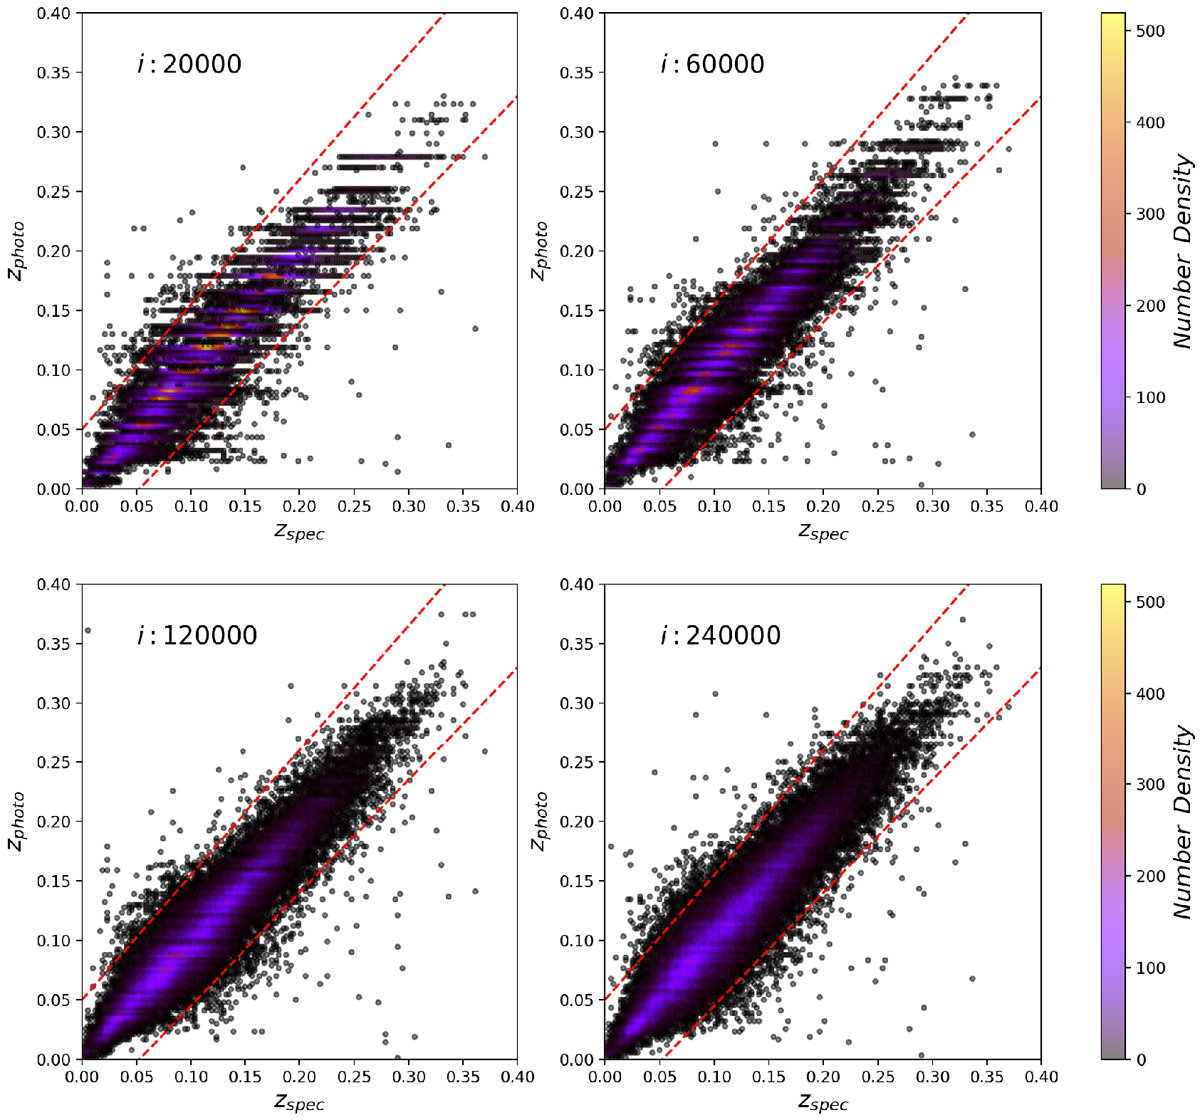
Fig. D.5
Download original image
Predicted photometric redshifts as a function of spectroscopic redshift color-coded with number density for the baseline method. We compare cases with different numbers of iterations in training using the SDSS data and and the network Net_P. The dashed red lines indicate the boundaries (zphoto - zspec+ zspec) = ±0.05 for outliers defined for the SDSS data as in Pasquet et al. (2019) and Treyer et al. (in prep.).
Current usage metrics show cumulative count of Article Views (full-text article views including HTML views, PDF and ePub downloads, according to the available data) and Abstracts Views on Vision4Press platform.
Data correspond to usage on the plateform after 2015. The current usage metrics is available 48-96 hours after online publication and is updated daily on week days.
Initial download of the metrics may take a while.