Fig. 2
Download original image
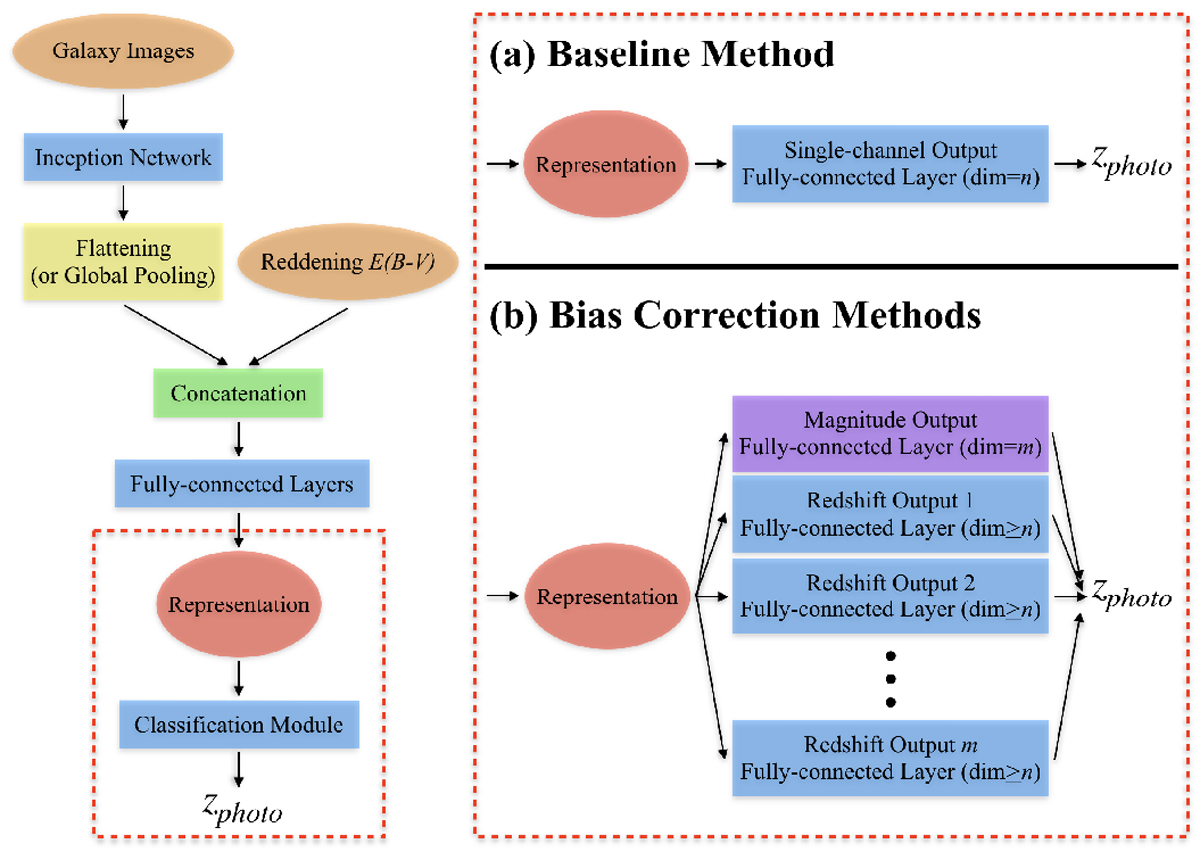
Graphic illustration of the CNN models for the baseline method and our methods for correcting zspec-dependent residuals and mode collapse. We use the network architecture adopted by Pasquet et al. (2019), in which multiscale inception modules (Szegedy et al. 2015) are used and the galactic reddening of galaxies is input in addition to images. The representation is obtained at the penultimate fully connected layer. The classification module is elaborated in the red rectangle: while the baseline method takes a final fully connected layer as a single-channel output for redshift prediction, our methods take parallel fully connected layers as multiple output channels to predict redshifts that also incorporate the magnitude information (discussed in Sect. 3.2.1). The labels n and m indicate the dimensions of the output layers, whose values are given in Table 1 for the SDSS data and the CFHTLS data. ≥ n means that additional bins are appended to the redshift outputs in step 3.
Current usage metrics show cumulative count of Article Views (full-text article views including HTML views, PDF and ePub downloads, according to the available data) and Abstracts Views on Vision4Press platform.
Data correspond to usage on the plateform after 2015. The current usage metrics is available 48-96 hours after online publication and is updated daily on week days.
Initial download of the metrics may take a while.