Fig. 6
Download original image
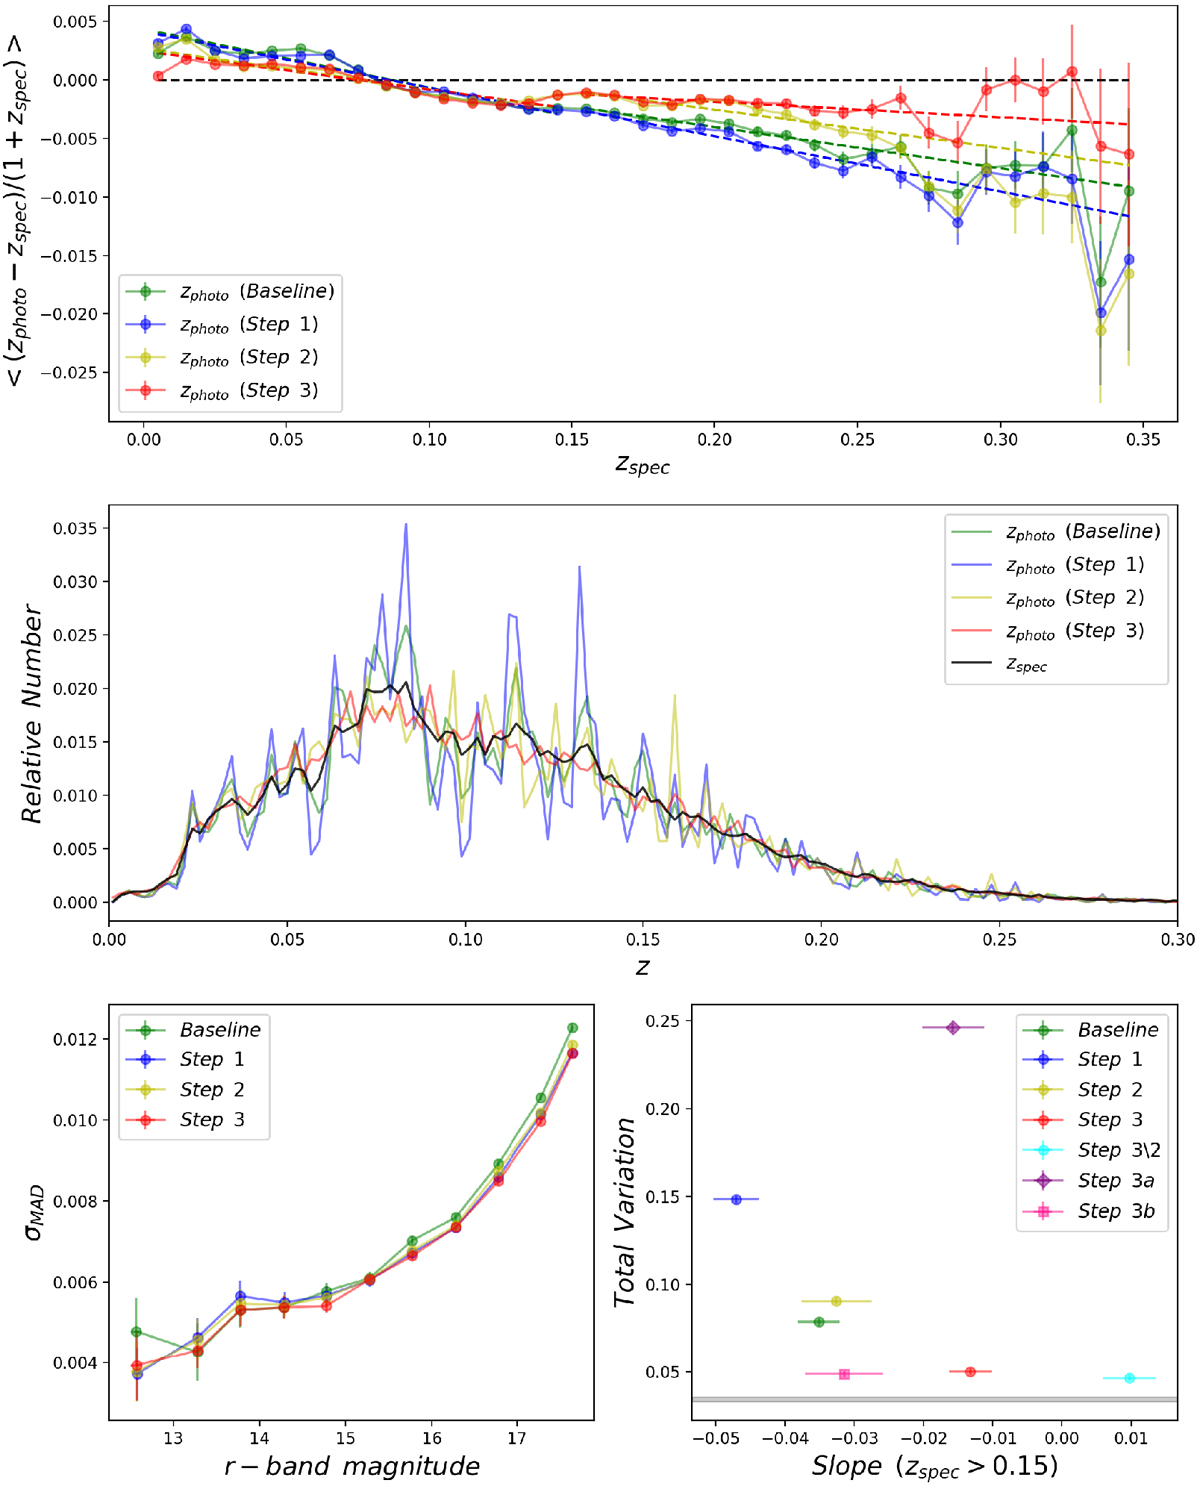
Main results of correcting zspec-dependent residuals and mode collapse with the SDSS data and the network Net_P. Upper panel: mean residuals as a function of spectroscopic redshift for the baseline method and steps 1-3 of our methods with the SDSS data and the network Net_P. The corresponding < Δz > − zspec piecewise linear fits (Eq. (9)) are shown as dashed lines with the same colors. Zero residual is indicated by the horizontal dashed black line. Middle panel: sample distributions of the estimated photometric and spectroscopic redshift in different cases. Lower left panel: σMAD (Eq. (11)) as a function of r-band magnitude. Lower right panel: total variation distance between the zphoto and zspec sample distributions (Eq. (10)) as a function of the slope of the < Δz > − zspec piecewise linear fit (Eq. (9)) in the high-redshift interval. The shaded area shows the total variation distance with the 1 a uncertainty for the simulated zphoto sample distribution for the baseline method that is expected to have no mode collapse. Step 3\2 denotes a case in which step 3 is applied without step 2. Step 3a denotes a variant case of step 3 in which hard labels are used instead of soft labels, but the means are adjusted. Step 3b denotes a case in which soft labels are used but the means are not adjusted.
Current usage metrics show cumulative count of Article Views (full-text article views including HTML views, PDF and ePub downloads, according to the available data) and Abstracts Views on Vision4Press platform.
Data correspond to usage on the plateform after 2015. The current usage metrics is available 48-96 hours after online publication and is updated daily on week days.
Initial download of the metrics may take a while.