Fig. 3
Download original image
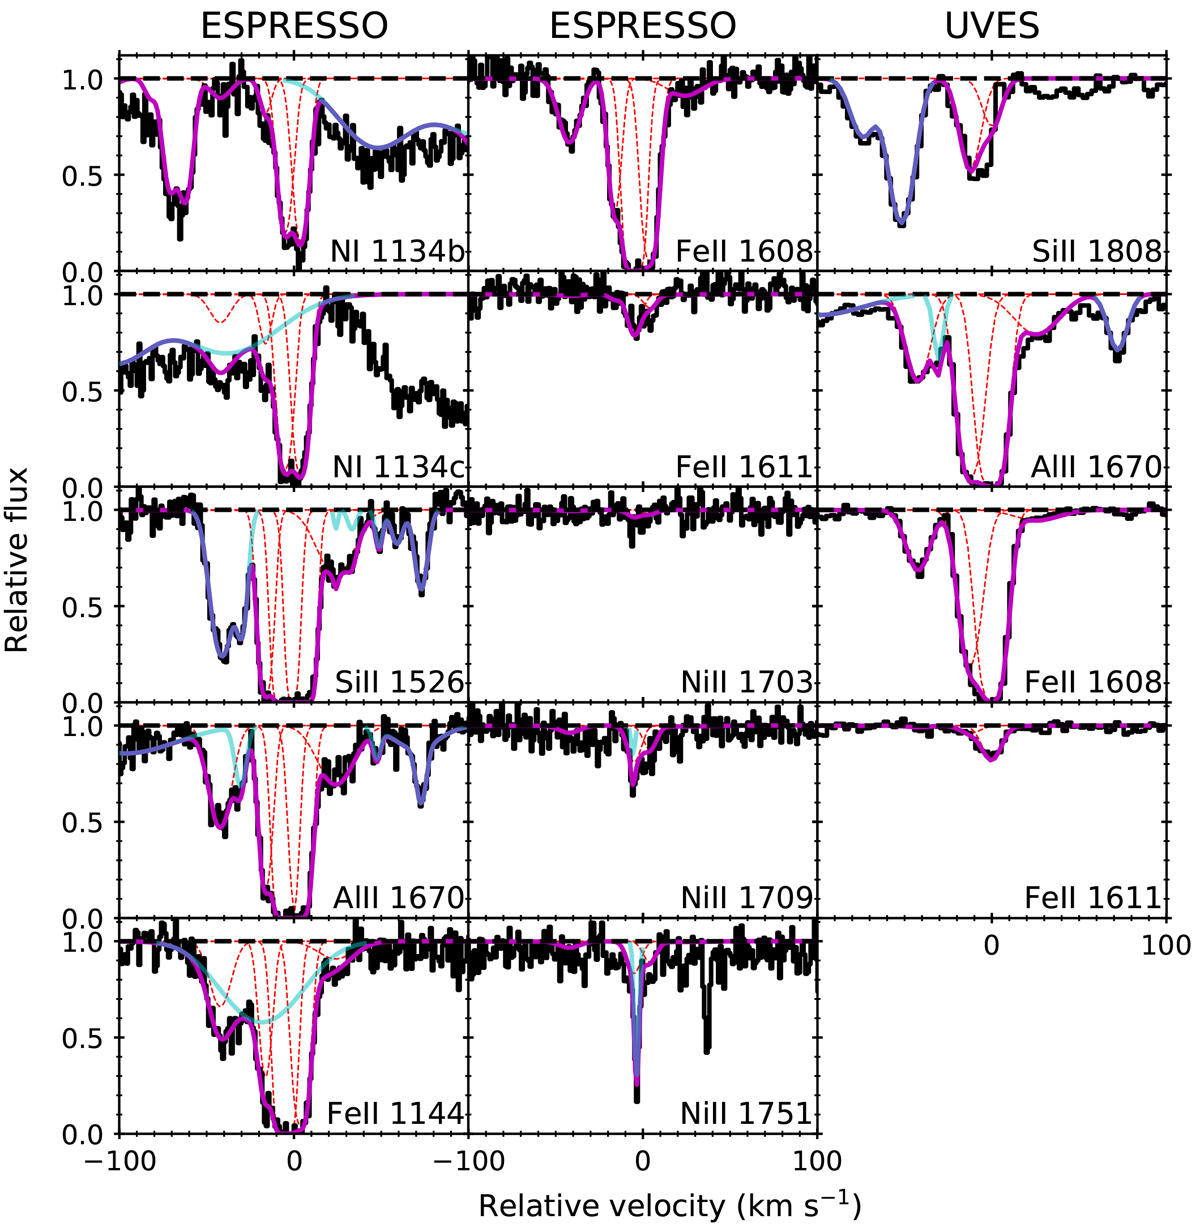
Velocity proflies of key low-ionisation absorption lines (labelled in the bottom right corner of each panel) detected within the continuum-normalised data (black lines) of QSO J0003–2603. The panels of the left two columns of the figure denote data from ESPRESSO, while the rightmost column shows the absorption lines of the UVES data. The solid magenta curve denotes the complete Voigt profile fitted to the data, while the red dashed lines denote the components that constitute the fit. Overplotted in cyan are the blended components. Although the profile for N I λ1134.1 Å was not fit due uncertain continuum blueward of the line, the expected profile shape based on the fits of the other two triplet lines (Λ1134.4 Å [1134b] and λ1135.0 Å [1134c]) is shown in the N I 1134b panel at ≈−70 km s−1.
Current usage metrics show cumulative count of Article Views (full-text article views including HTML views, PDF and ePub downloads, according to the available data) and Abstracts Views on Vision4Press platform.
Data correspond to usage on the plateform after 2015. The current usage metrics is available 48-96 hours after online publication and is updated daily on week days.
Initial download of the metrics may take a while.