Fig. 5
Download original image
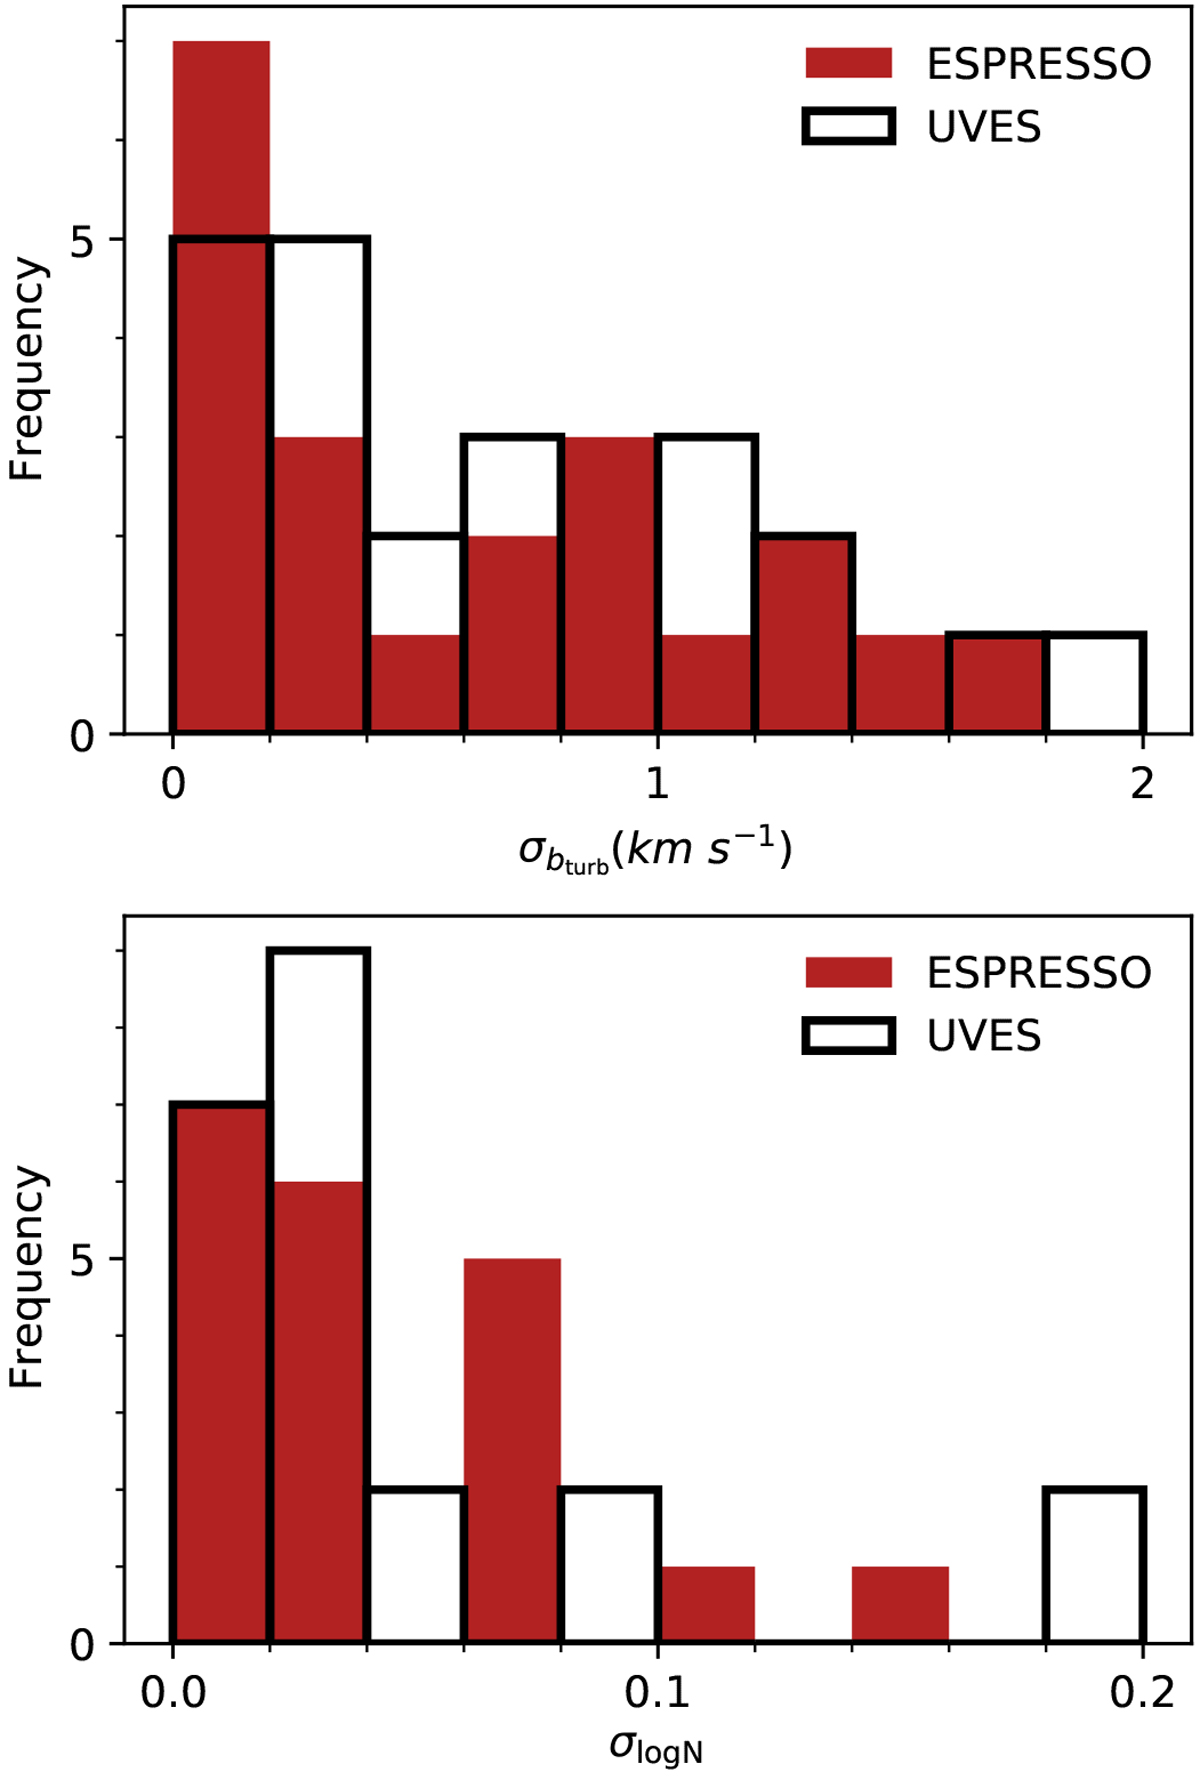
Distributions of errors on fitted components’ bturb (top panel) and log N (bottom panel) for ions Al II, Fe II, and C IV from ESPRESSO (solid red bars) and UVES (hollow black bars) fits assuming the same number of components as the ESPRESSO fits for the respective ions (Tables 1 and 2). The UVES distributions show the errors derived from fitting the same redshift components as used in the ESPRESSO fits in order to provide an equal comparison. Despite the lower S/N in the ESPRESSO data, the errors on the component fits for ESPRESSO are similar in magnitude as those of UVES.
Current usage metrics show cumulative count of Article Views (full-text article views including HTML views, PDF and ePub downloads, according to the available data) and Abstracts Views on Vision4Press platform.
Data correspond to usage on the plateform after 2015. The current usage metrics is available 48-96 hours after online publication and is updated daily on week days.
Initial download of the metrics may take a while.