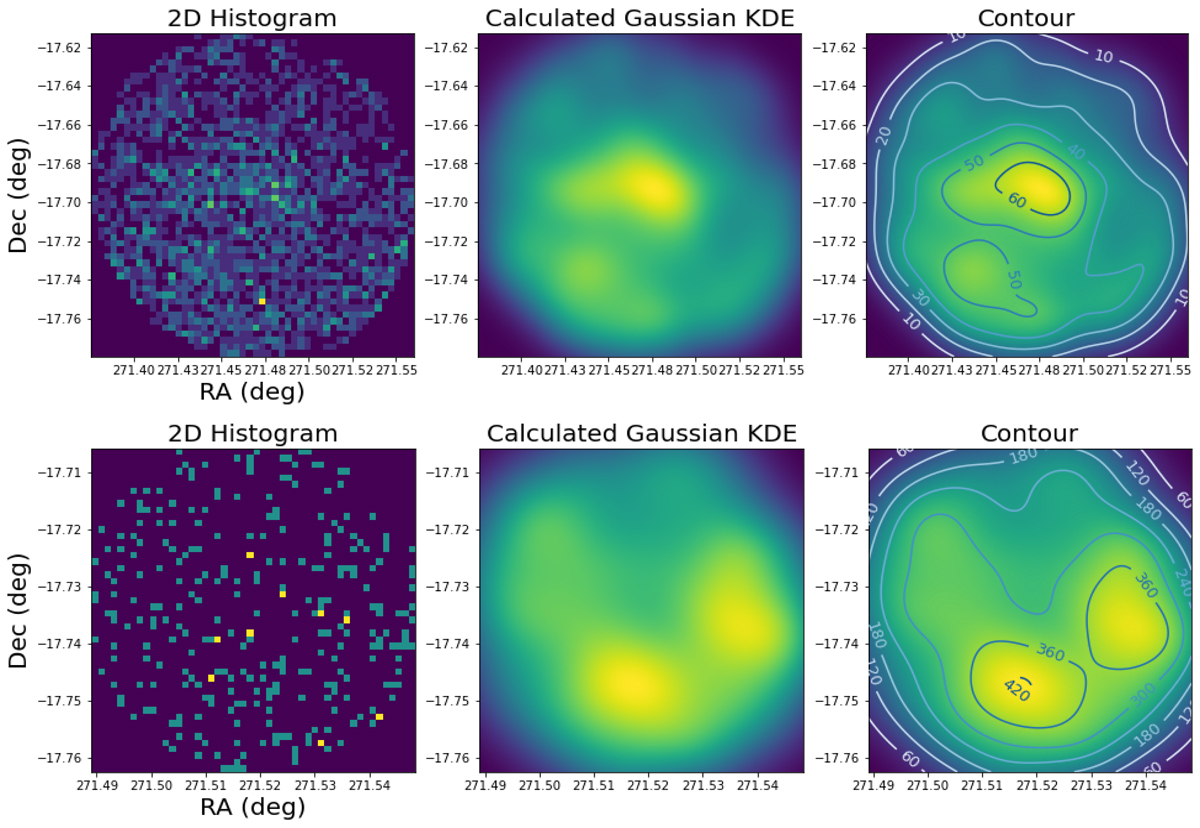
Fig. 3.
Download original image
Spatial distribution for Garro 02 selected at r ≲ 4′ (on the top). We also compare the cluster spatial distribution with its relative field (on the bottom) selected at 5′≲r ≲ 8′ from the cluster centre. We used the KDE technique in order to better distinguish the over-densities (yellow and green colours) from lower densities (blue colours). All samples were cleaned by nearby stars. These panels show the following from left to right: the 2D histograms and the calculated Gaussian KDE on the which we overplotted iso-density contours.
Current usage metrics show cumulative count of Article Views (full-text article views including HTML views, PDF and ePub downloads, according to the available data) and Abstracts Views on Vision4Press platform.
Data correspond to usage on the plateform after 2015. The current usage metrics is available 48-96 hours after online publication and is updated daily on week days.
Initial download of the metrics may take a while.