Fig. 1.
Download original image
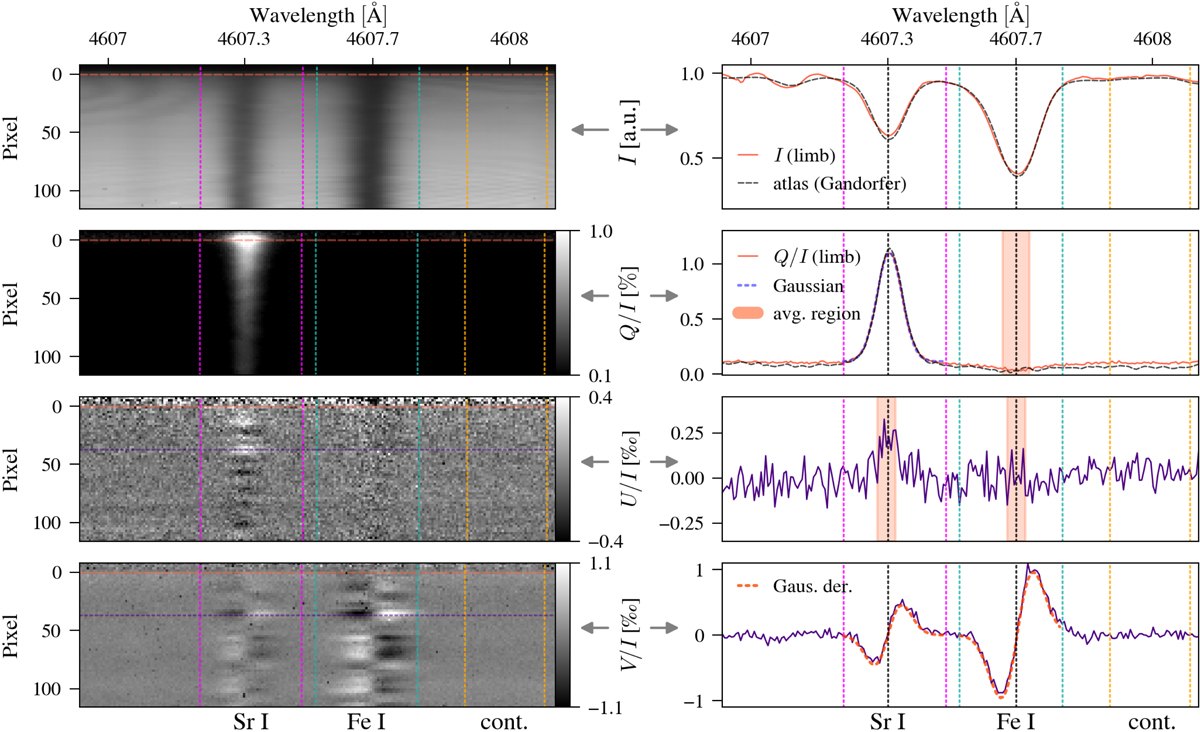
ZIMPOL Stokes images containing different limb distances (left) and example spectra at specific locations (right). Four left panels: I, Q/I, U/I, and V/I (top to bottom, respectively) Stokes images after the data reduction. The CLV is along the spatial pixels of the camera. Three spectral regions are identified in the images: Sr I, Fe I, and continuum, indicated by the colored dotted vertical lines (Sr I = magenta, Fe I = cyan, continuum = orange). The limb position is indicated by the horizontal orange-red dashed line. Right panels show example spectra: Stokes I and Q/I close to the limb (together with the spectra given in the Second Solar Spectrum atlas by Gandorfer 2002), Stokes U/I and V/I in a magnetically active region (position indicated by the purple lines in the left images). The Q/I in the Sr I region is fitted with a Gaussian, while V/I in Sr I and Fe I is fitted with a Gaussian derivative. Regions that are averaged for further data analysis are indicated by the light orange bands.
Current usage metrics show cumulative count of Article Views (full-text article views including HTML views, PDF and ePub downloads, according to the available data) and Abstracts Views on Vision4Press platform.
Data correspond to usage on the plateform after 2015. The current usage metrics is available 48-96 hours after online publication and is updated daily on week days.
Initial download of the metrics may take a while.