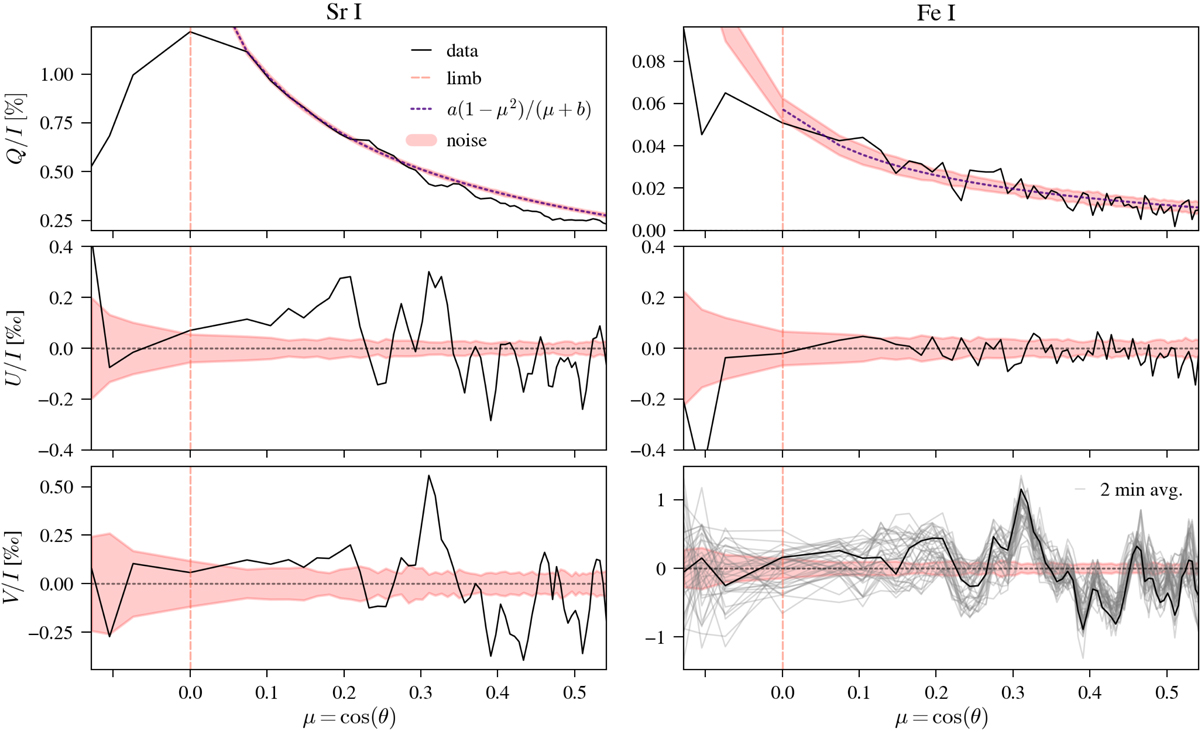
Fig. 3.
Download original image
Center-to-limb variations of the Q/I, U/I, and V/I amplitudes in Sr I (left) and Fe I (right) shown as black solid lines. The limb position is indicated by the vertical dashed-orange line. The estimated noise level is shaded in red. The CLV of Q/I is fitted with the function presented in the text, shown as a black-dashed line (for U/I and V/I the black-dashed line is set to zero). At this scale, the estimated noise level band in Q/I of Sr I is very small. For V/I in Fe I we additionally plot with gray lines the red peak averaged over ∼2 min and 15 spectral pixels. See text for details on the parameters a and b for the function (black dotted line) fitted to the Q/I CLV.
Current usage metrics show cumulative count of Article Views (full-text article views including HTML views, PDF and ePub downloads, according to the available data) and Abstracts Views on Vision4Press platform.
Data correspond to usage on the plateform after 2015. The current usage metrics is available 48-96 hours after online publication and is updated daily on week days.
Initial download of the metrics may take a while.