Fig. 4.
Download original image
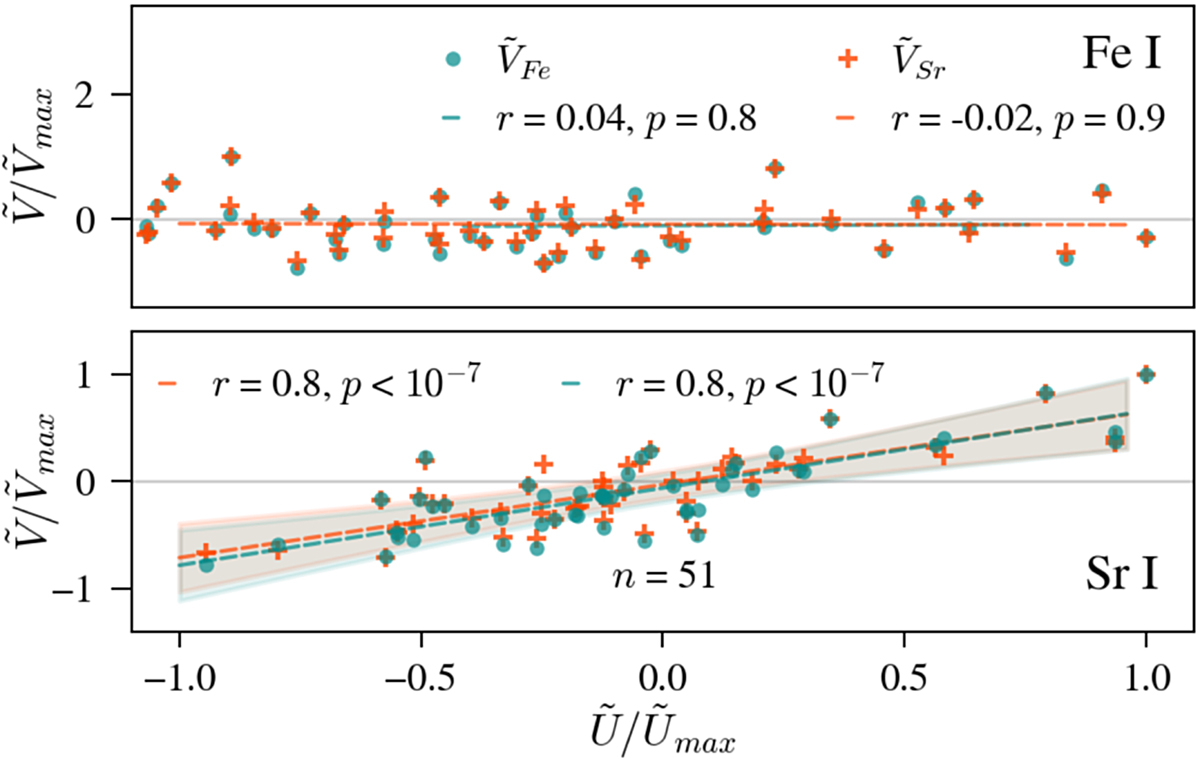
Scatter and correlation of ![]() amplitudes in Fe I (top) and Sr I (bottom) with circular polarization amplitudes
amplitudes in Fe I (top) and Sr I (bottom) with circular polarization amplitudes ![]() of Fe I (circles) and Sr I (plus), respectively, scaled to their maximum values. The notation
of Fe I (circles) and Sr I (plus), respectively, scaled to their maximum values. The notation ![]() is used here. The Pearson’s correlation coefficient r is determined together with the p-value by the linear regression fitted to the scattered data and displayed in the panels (n: total number of scattered points). The shaded area is the 95% confidence interval for the fitted parameters.
is used here. The Pearson’s correlation coefficient r is determined together with the p-value by the linear regression fitted to the scattered data and displayed in the panels (n: total number of scattered points). The shaded area is the 95% confidence interval for the fitted parameters.
Current usage metrics show cumulative count of Article Views (full-text article views including HTML views, PDF and ePub downloads, according to the available data) and Abstracts Views on Vision4Press platform.
Data correspond to usage on the plateform after 2015. The current usage metrics is available 48-96 hours after online publication and is updated daily on week days.
Initial download of the metrics may take a while.