Fig. 7
Download original image
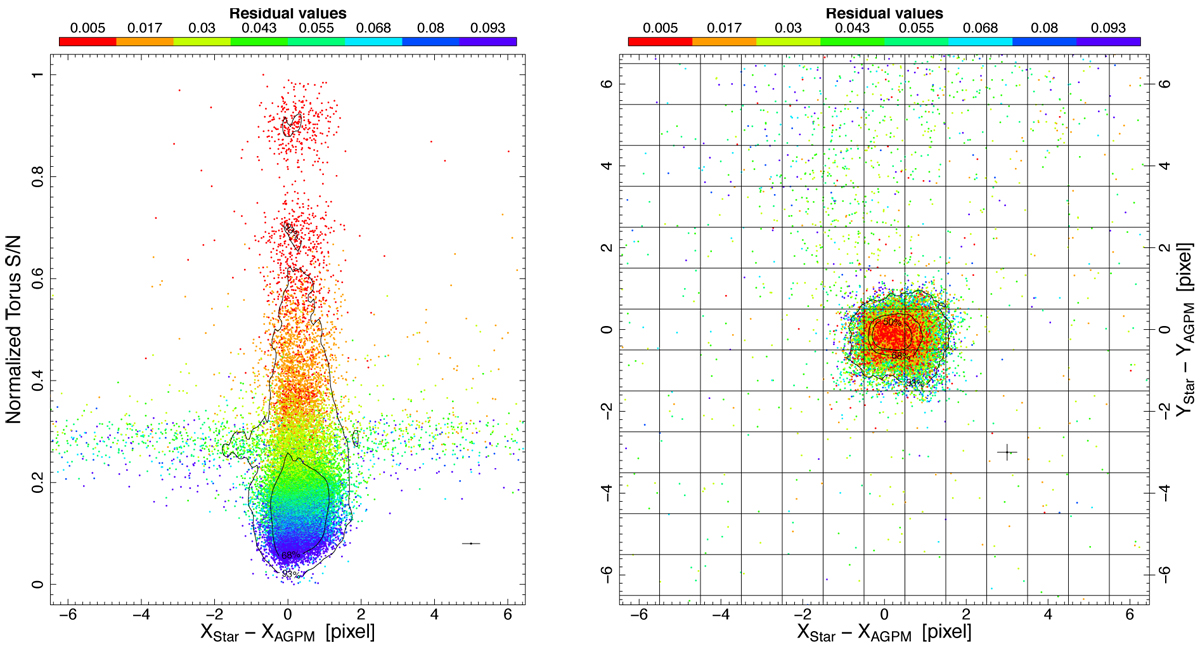
Examples of the distribution and registration of frames as a function of different parameters. Left: S/N of the torus as a function of the difference between the positions of the star and of the AGPM along the X-axis. Right: relative position of the star with respect to the position of the AGPM. For both panels the star is HD 34282 and the color-coding corresponds to the goodness of fit. The crosses in both panels correspond to the typical uncertainties. The contours contain 93 and 68% of the data in the left panel, and 93, 68, and 50% of the data in the right panel.
Current usage metrics show cumulative count of Article Views (full-text article views including HTML views, PDF and ePub downloads, according to the available data) and Abstracts Views on Vision4Press platform.
Data correspond to usage on the plateform after 2015. The current usage metrics is available 48-96 hours after online publication and is updated daily on week days.
Initial download of the metrics may take a while.