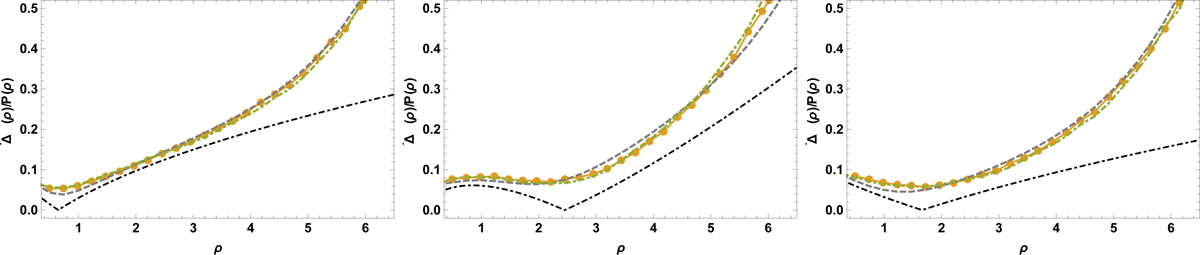
Fig. 6.
Download original image
Measured variance of the density PDF, i.e., diagonal elements of the covariance matrix, in sets 𝒜 and comparisons with proposed approximate forms. The yellow line and symbols are the results obtained in the numerical experiments. The dot-dashed line is the prediction derived from relation (86), and the dashed gray line shows the prediction from Eq. (85). The dot-dashed black lines correspond to the large-scale contributions.
Current usage metrics show cumulative count of Article Views (full-text article views including HTML views, PDF and ePub downloads, according to the available data) and Abstracts Views on Vision4Press platform.
Data correspond to usage on the plateform after 2015. The current usage metrics is available 48-96 hours after online publication and is updated daily on week days.
Initial download of the metrics may take a while.