Fig. 3
Download original image
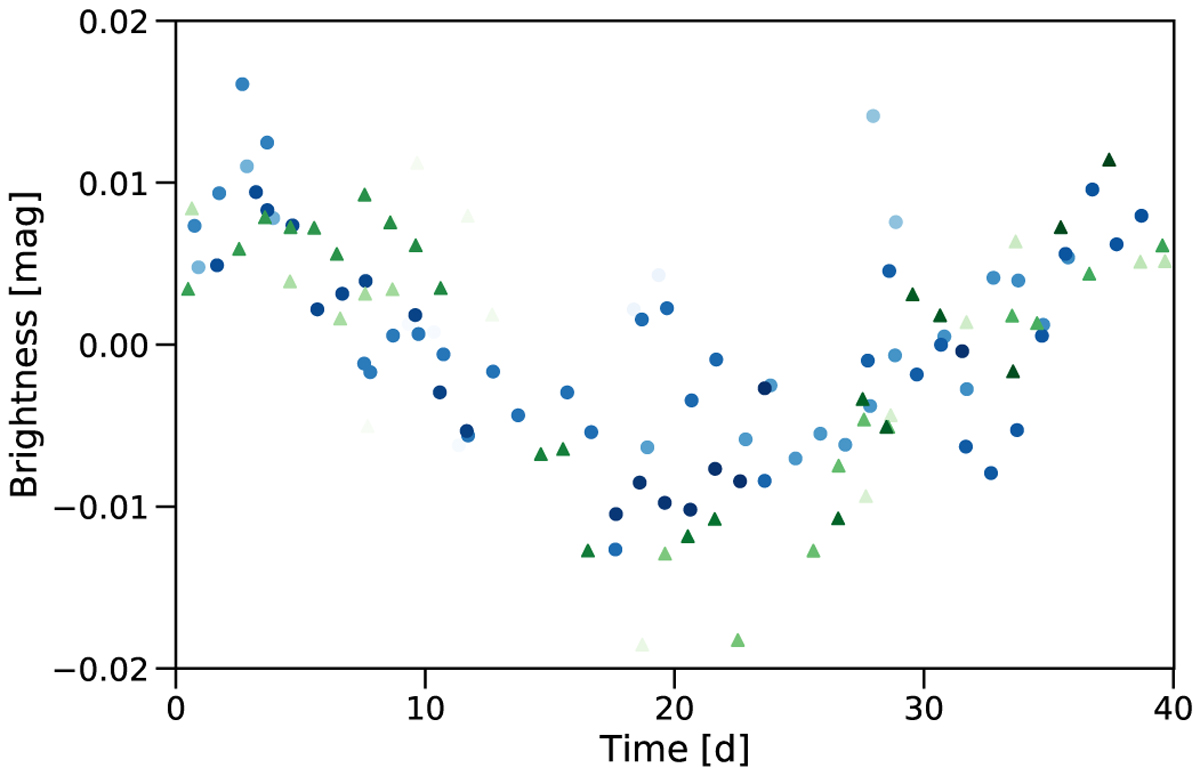
Differential photometry of TYC 2187-512-1, phase-folded to P = 40.0203 d. Each data point represents measurements averaged over one night. SuperWASP data are shown as blue circles, and OSN R-band data are represented by green triangles. Within each of the two time series, the symbols change from light to dark with progressing time. See the text for more details.
Current usage metrics show cumulative count of Article Views (full-text article views including HTML views, PDF and ePub downloads, according to the available data) and Abstracts Views on Vision4Press platform.
Data correspond to usage on the plateform after 2015. The current usage metrics is available 48-96 hours after online publication and is updated daily on week days.
Initial download of the metrics may take a while.