Fig. 1
Download original image
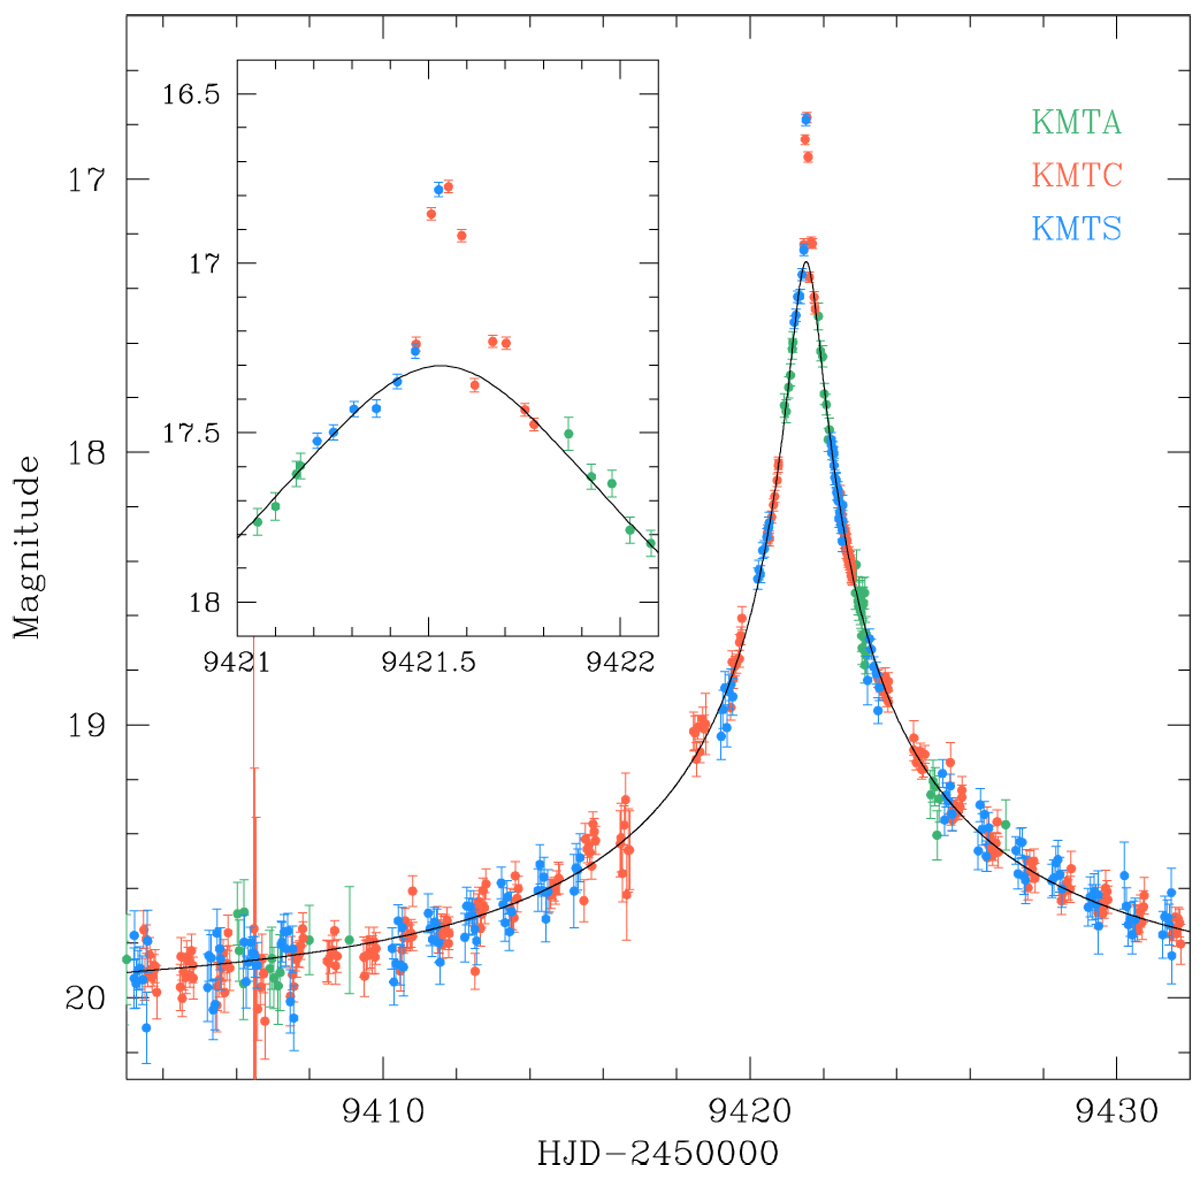
Light curve of KMT-2021-BLG-1898 constructed by combining the three data sets of the KMTNet telescopes: KMTA, KMTC, and KMTS. The inset shows the zoom-in view of the peak region exhibiting an anomaly feature. The curve drawn over the data point is a 1L1S model obtained by excluding the data points in the anomaly region. The colors of the data points are set to match those of the telescopes marked in the legend.
Current usage metrics show cumulative count of Article Views (full-text article views including HTML views, PDF and ePub downloads, according to the available data) and Abstracts Views on Vision4Press platform.
Data correspond to usage on the plateform after 2015. The current usage metrics is available 48-96 hours after online publication and is updated daily on week days.
Initial download of the metrics may take a while.