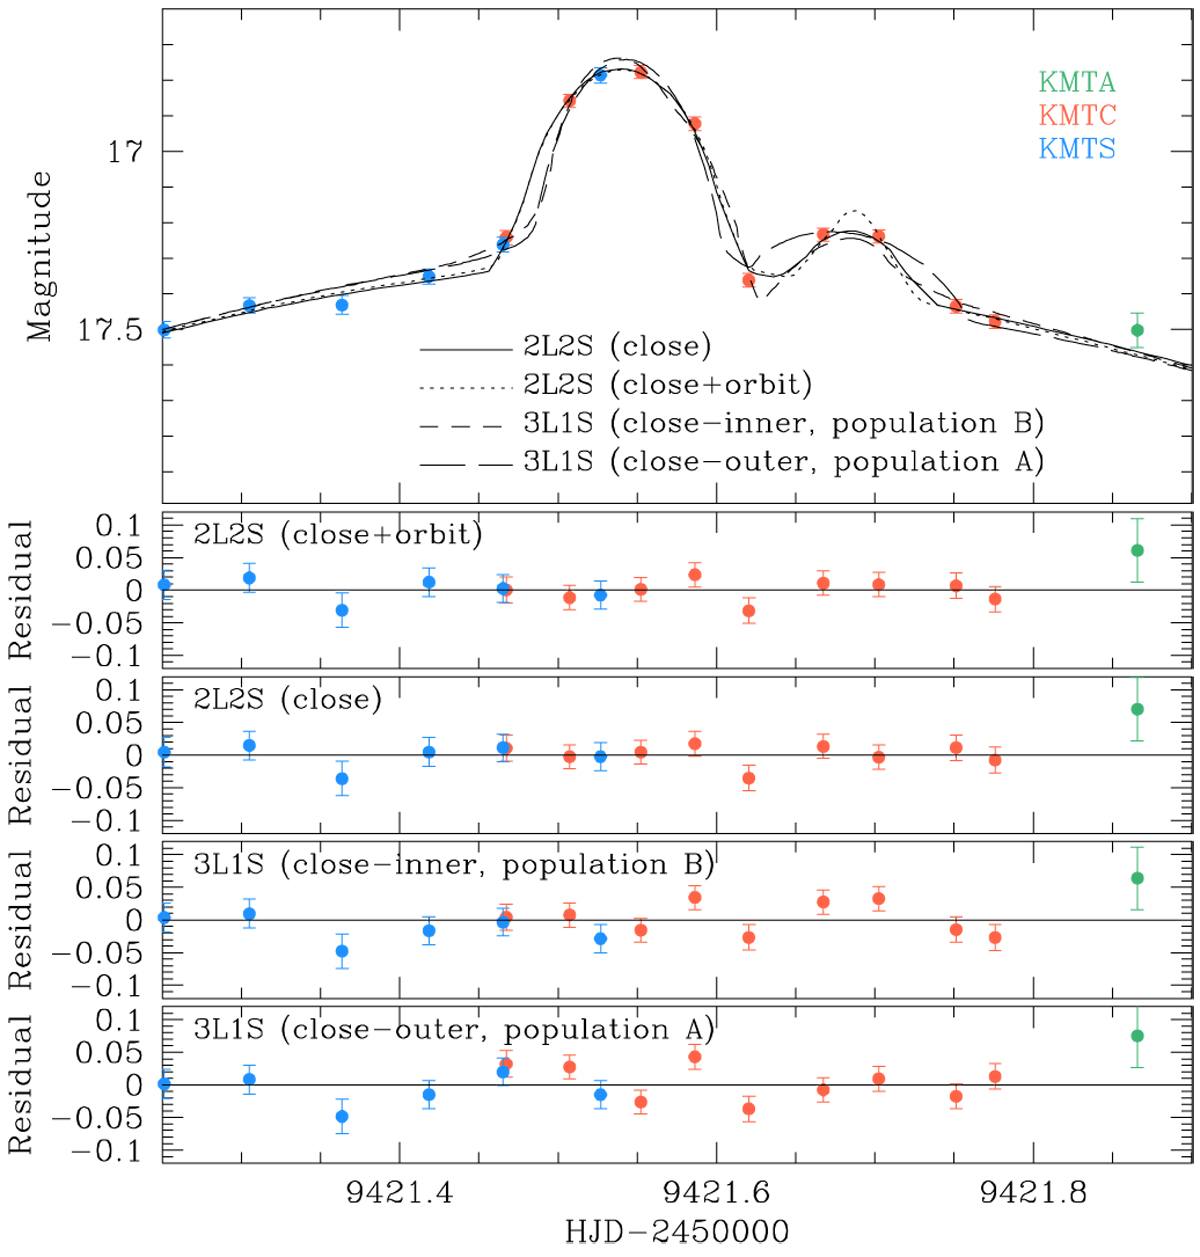
Fig. 2
Download original image
Zoom-in view around the peak of the light curve. The four curves drawn over the data points are the two 2L2S and two 3L1S models. One of the 2L2L (labeled as “close+orbit”) model is obtained considering the orbital motion of the binary source, while the other model (“close”) is found without considering the source orbital motion. The four lower panels show the residuals from the individual models.
Current usage metrics show cumulative count of Article Views (full-text article views including HTML views, PDF and ePub downloads, according to the available data) and Abstracts Views on Vision4Press platform.
Data correspond to usage on the plateform after 2015. The current usage metrics is available 48-96 hours after online publication and is updated daily on week days.
Initial download of the metrics may take a while.