Open Access
Fig. 8
Download original image
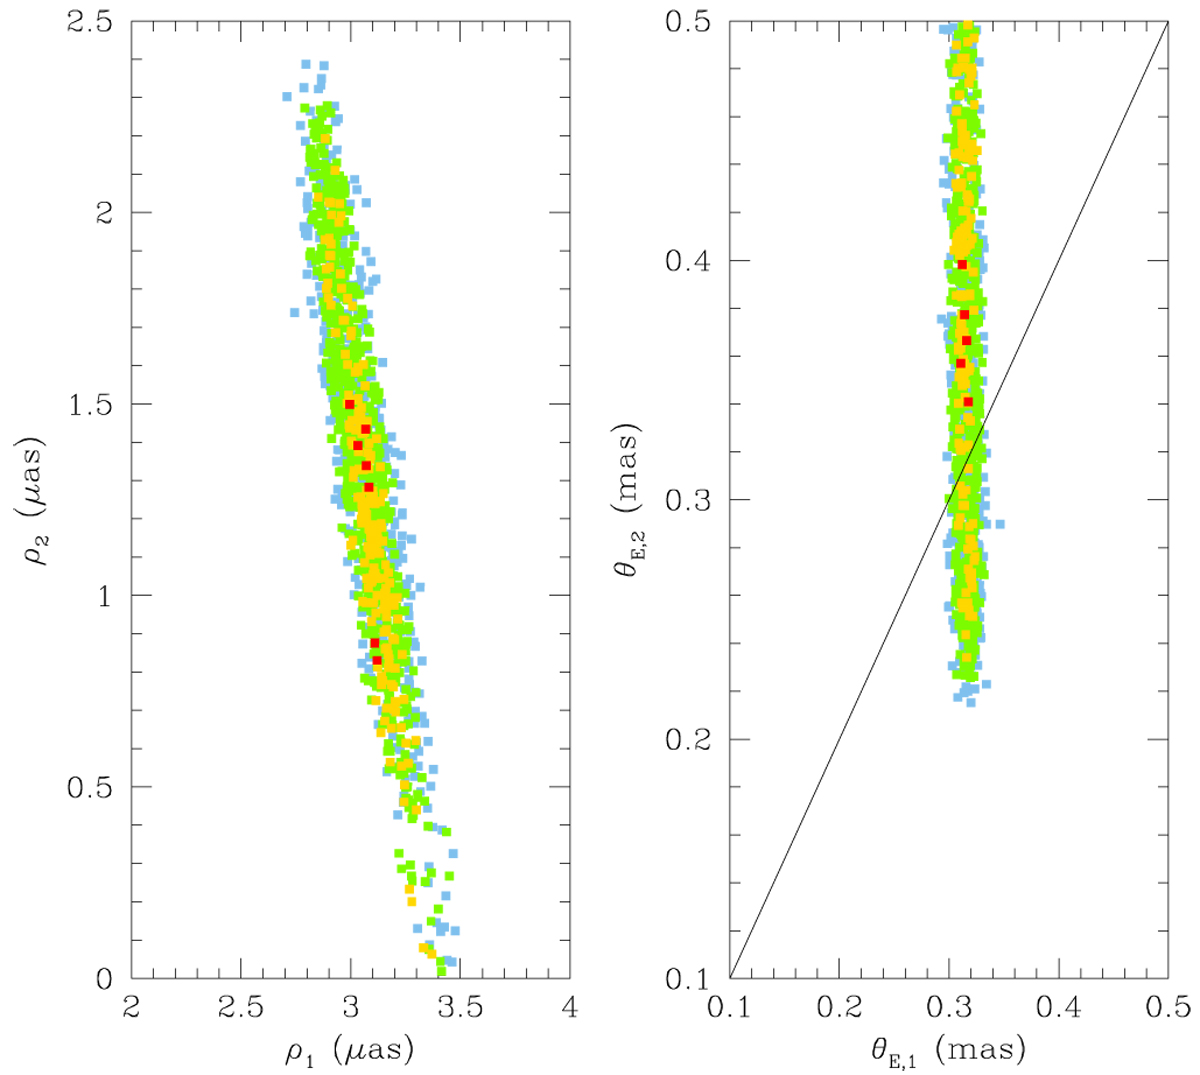
Scatter plot of points in the MCMC chain on the ρ1–ρ2 (left panel) and θΕ,1–θΕ,2 (right panel) planes obtained from the 2L2S modeling. The color coding is the same as that in Fig. 2 except that n = 1. The diagonal line in the right panel represents the relation θΕ,1 = θΕ,2.
Current usage metrics show cumulative count of Article Views (full-text article views including HTML views, PDF and ePub downloads, according to the available data) and Abstracts Views on Vision4Press platform.
Data correspond to usage on the plateform after 2015. The current usage metrics is available 48-96 hours after online publication and is updated daily on week days.
Initial download of the metrics may take a while.