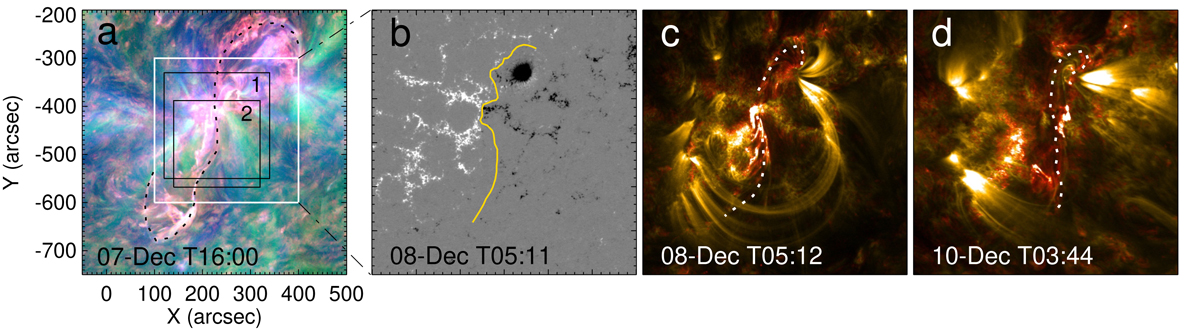
Fig. 1.
Download original image
FC at different evolutionary stages. Panel a: composite of the AIA 304 Å, 211 Å, and 171 Å images showing the filament eruption on 2020 Dec. 7. The white box shows the FOV of panels b–d. The black boxes 1 and 2 show the FOVs of the ONSET and NVST images as shown in Figs. 2b and 3, respectively. Panel b: HMI line-of-sight magnetogram with the main PIL indicated by the gold line. Panels c–d: composite of the AIA 304 Å and 171 Å images showing the remained FC and the confined filament eruption. The dashed line indicate the corresponding FC at different instants.
Current usage metrics show cumulative count of Article Views (full-text article views including HTML views, PDF and ePub downloads, according to the available data) and Abstracts Views on Vision4Press platform.
Data correspond to usage on the plateform after 2015. The current usage metrics is available 48-96 hours after online publication and is updated daily on week days.
Initial download of the metrics may take a while.