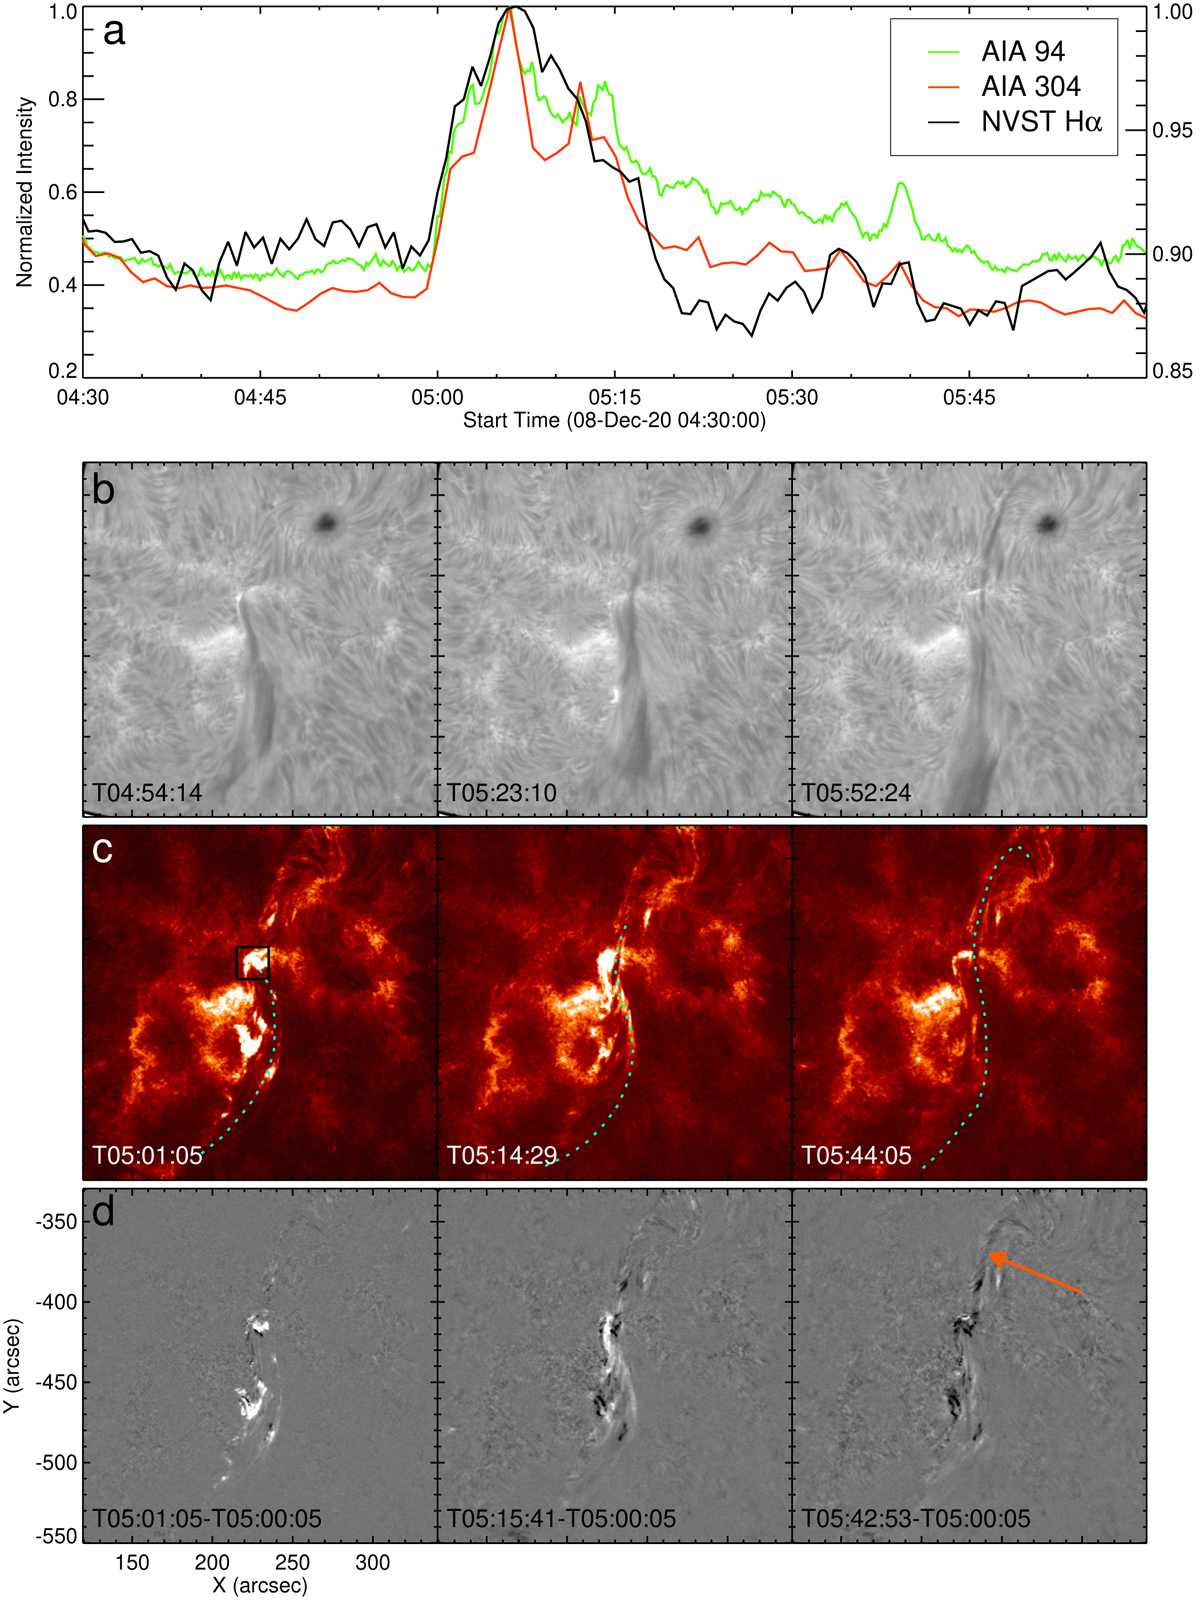
Fig. 2.
Download original image
Evolution of the FC in Hα and EUV waves. Panel a: temporal evolution of the normalized AIA 94 Å, 304 Å, and Hα intensities within the black box in panel c. Panel b: ONSET Hα images showing the formation of the filament threads. They are aligned with the AIA images through cross-correlation between the ONSET and HMI white-light images. Panels c and d: AIA 304 Å and corresponding running-difference images. The dashed line represents the filament threads, and the orange arrow points out the transferred filament.
Current usage metrics show cumulative count of Article Views (full-text article views including HTML views, PDF and ePub downloads, according to the available data) and Abstracts Views on Vision4Press platform.
Data correspond to usage on the plateform after 2015. The current usage metrics is available 48-96 hours after online publication and is updated daily on week days.
Initial download of the metrics may take a while.