Fig. 3
Download original image
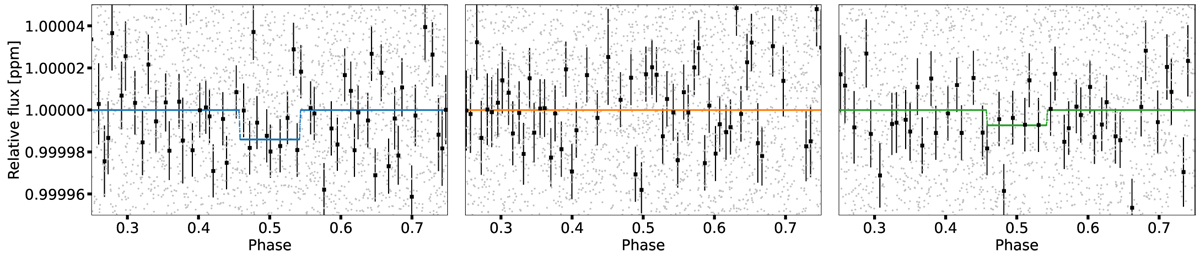
Zoom on the phase-folded relative flux displaying the occultation. The silver dots are detrended flux and the black dots are binned data with their corresponding uncertainty. Left: detrended flux and best-fit occultation model in blue, corresponding to sector 21. Middle: detrended flux and best-fit occultation model in orange, corresponding to sector 44. Right: detrended flux and best-fit occultation model in green, corresponding to sector 46.
Current usage metrics show cumulative count of Article Views (full-text article views including HTML views, PDF and ePub downloads, according to the available data) and Abstracts Views on Vision4Press platform.
Data correspond to usage on the plateform after 2015. The current usage metrics is available 48-96 hours after online publication and is updated daily on week days.
Initial download of the metrics may take a while.