Open Access
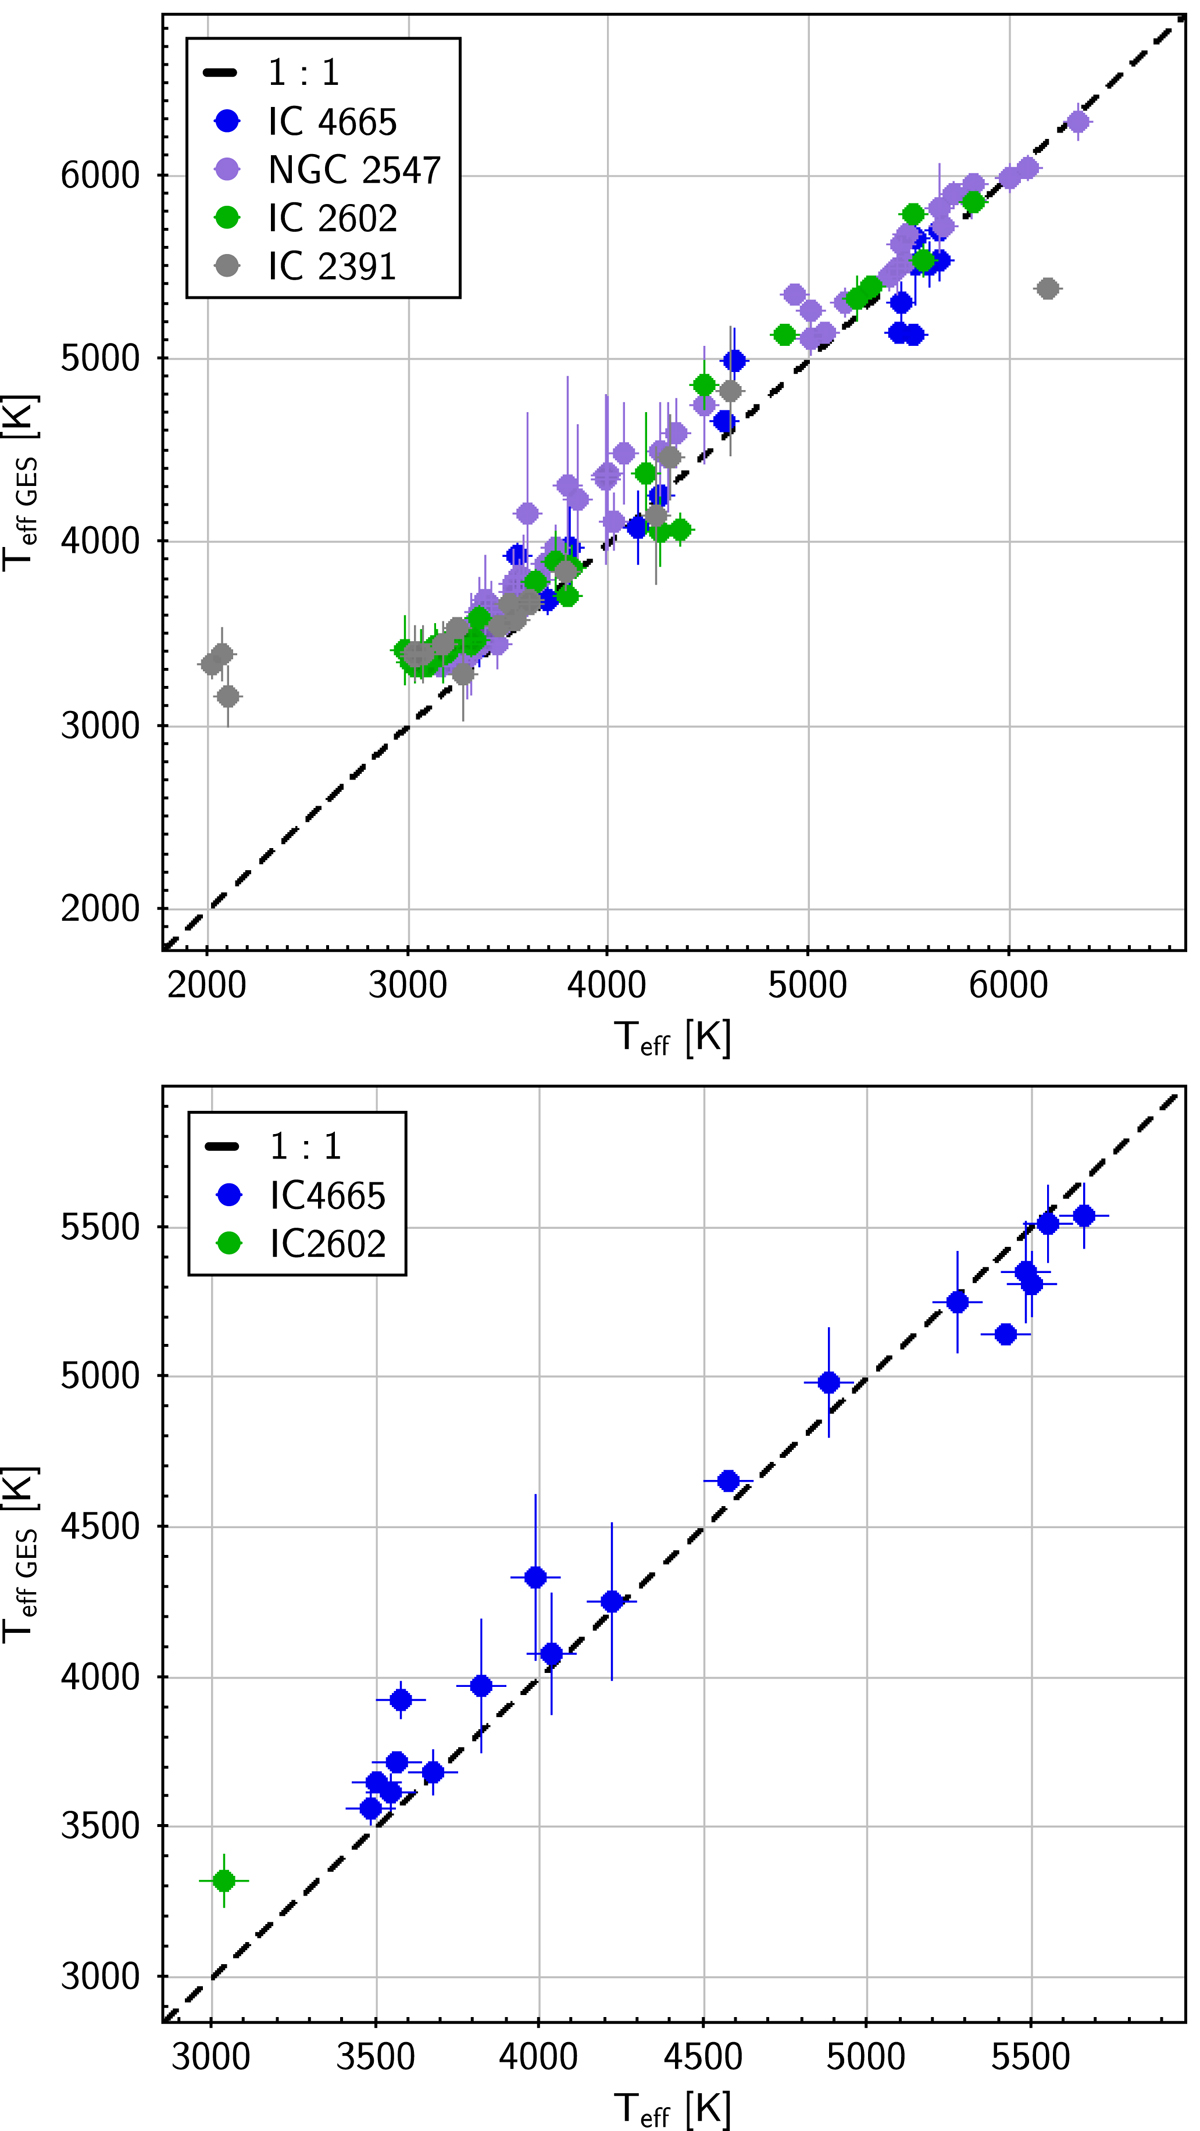
Fig. 12.
Download original image
Comparison of effective temperatures derived in Randich et al. (2018) and from VOSA. Top: all the sources are members from Gaia Collaboration (2018b) with counterpart in Randich et al. (2018). Bottom: only sources considered as members after this work from the LDB samples with counterpart in Randich et al. (2018).
Current usage metrics show cumulative count of Article Views (full-text article views including HTML views, PDF and ePub downloads, according to the available data) and Abstracts Views on Vision4Press platform.
Data correspond to usage on the plateform after 2015. The current usage metrics is available 48-96 hours after online publication and is updated daily on week days.
Initial download of the metrics may take a while.