Fig. A.5.
Download original image
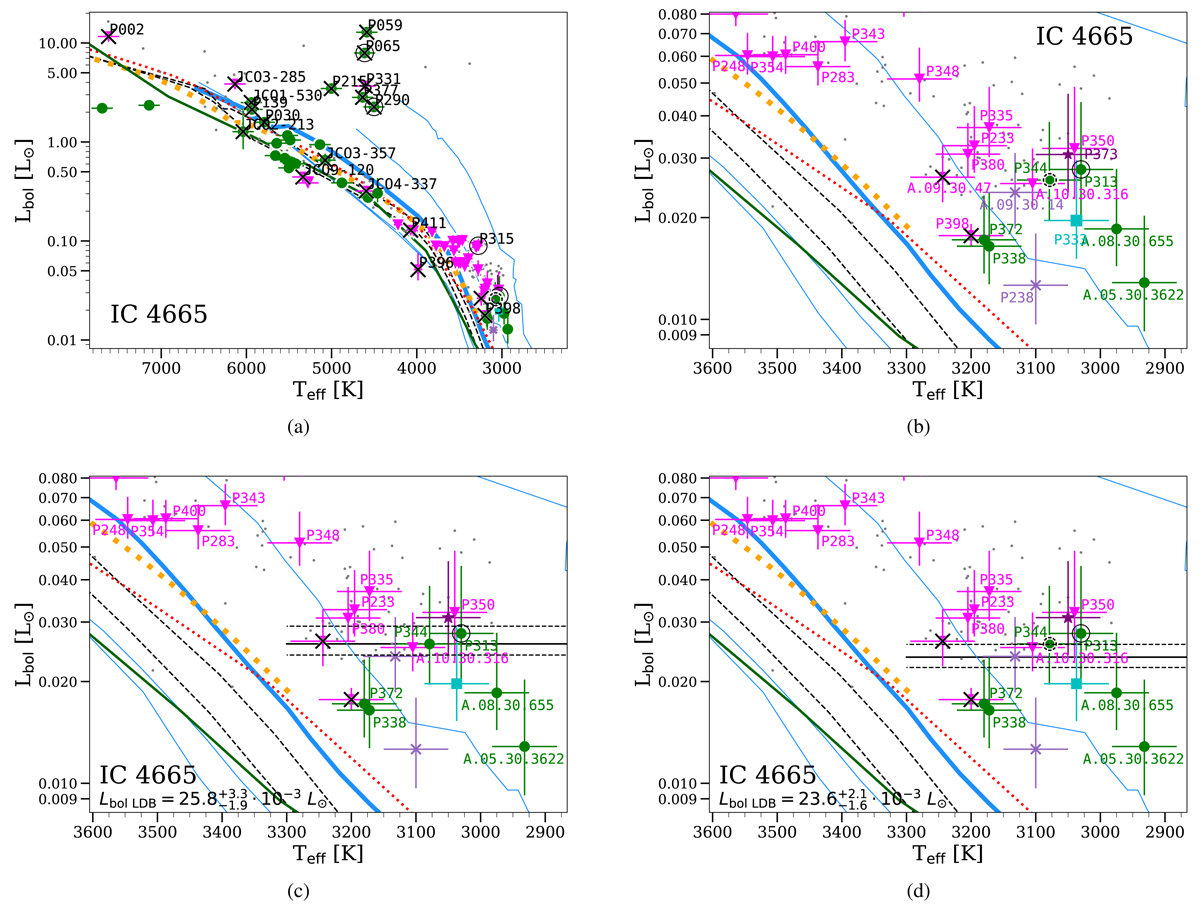
HRDs and the LDB for IC 4665. (a) the same as in Figs. 6 and A.2 but for IC 4665. The violet crosses are sources with undetected or dubious lithium detections due to their low resolution spectrum or other technical disabilities. Thin blue lines correspond to isochrones of 1, 10, 100 Ma, and 1 Ga from the BT-Settl models (Allard et al. 2013), while the thick blue one to 30 Ma. The figure includes: a 20 Ma and a 30 Ma isochrones from D’Antona & Mazzitelli 1994 (black dashed lines), a 25 Ma isochrone from Tognelli et al. 2011 (orange dashed dot line), a 30 Ma isochrone from Siess et al. 2000 (red dotted line). (b) Zoom on the previous plot around the LDB with all the source names. (c) A black horizontal line marks the Lbol LDB, together with the 16th and 84th percentiles (dashed lines), following the first scenario, see Section 2.3. (d) Same as (b), but the the Lbol LDB is located following the second scenario, see Section 2.3. It is ![]() Ma old using the BT-Settl bolometric luminosity-age relationship (Allard et al. 2012).
Ma old using the BT-Settl bolometric luminosity-age relationship (Allard et al. 2012).
Current usage metrics show cumulative count of Article Views (full-text article views including HTML views, PDF and ePub downloads, according to the available data) and Abstracts Views on Vision4Press platform.
Data correspond to usage on the plateform after 2015. The current usage metrics is available 48-96 hours after online publication and is updated daily on week days.
Initial download of the metrics may take a while.