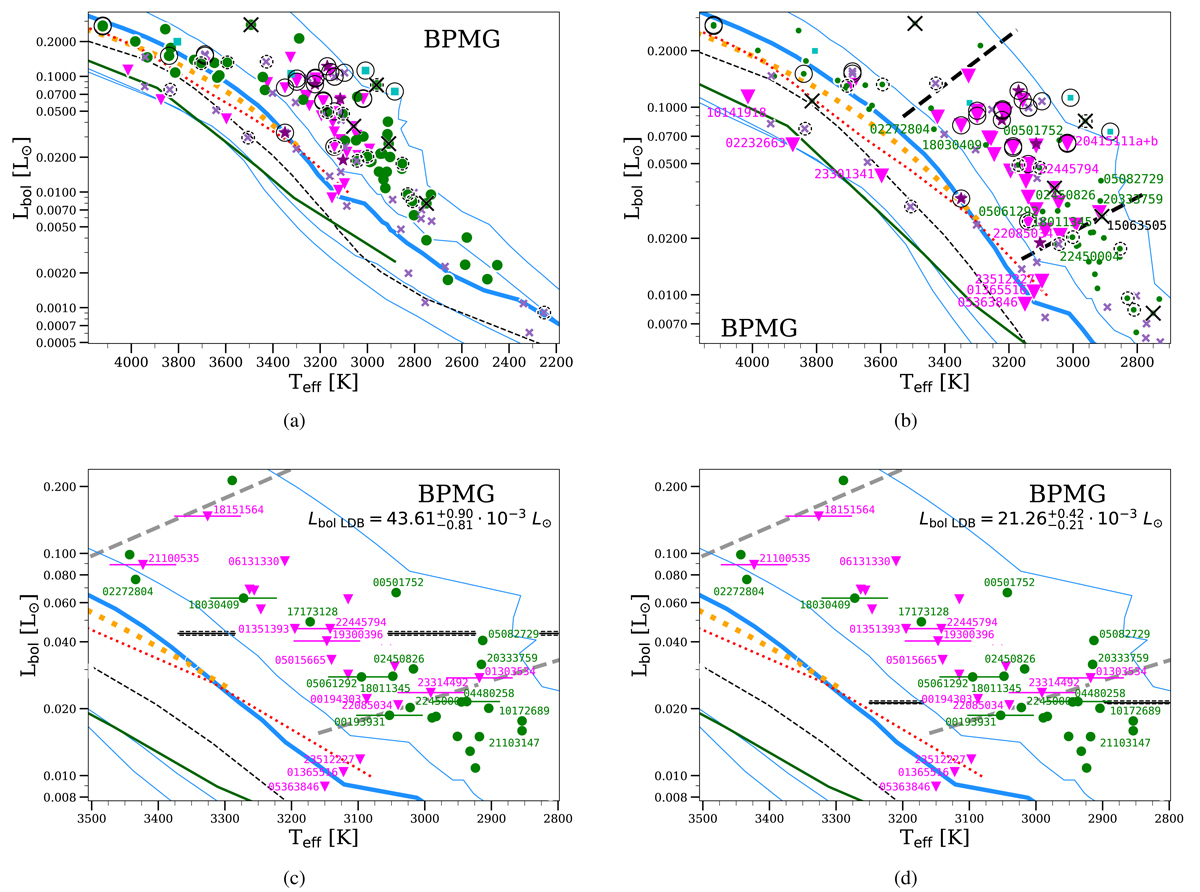
Fig. A.19.
Download original image
HRDs and the LDB for the BPMG. (a) The same as in Fig. 6 but for the BPMG. Empty large black broken line circles are suspected multiple systems or sources with associated background objects and photometric data blended in some bands. Thin blue lines correspond to isochrones of 1, 10, 100 Ma, and 1 Ga from the BT-Settl models (Allard et al. 2013), while the thick blue one to 20 Ma. Uncertainties are not shown in order to gain clarity, although in the bolometric luminosities are usually smaller than the symbols, with the exception of some sources without parallaxes. The figure includes 20 Ma isochrones from: D’Antona & Mazzitelli 1994 (black dashed line), Siess et al. 2000 (red dotted line), and a 17 Ma from Tognelli et al. 2011 (orange dashed dot line). (b) Zoom on the (a) plot around the LDB. The size of lithium-poor sources has been increased to locate the LDB. The area delimited by them is marked with gray thick dashed lines. Some remarkable sources are labelled. (c) Same as the previous plot with the LDB locus determined following the first scenario. Since we focus on the sole aim of locating the LDB, we do not show: sources that are confirmed or suspected multiple systems; sources with two or several associated objects (third configuration) with photometric data blended in some bands; non-members; sources with undetected lithium feature; and objects without parallaxes. Effective temperatures uncertainties are shown in some lithium poor objects in order to gain clarity, Bolometric luminosities uncertainties are smaller than the size of the symbols. The BPMG is ![]() Ma old using the BT-Settl bolometric luminosity-age relationship (Allard et al. 2012). (d) Same as the previous plot with the LDB locus determined following the second scenario.
Ma old using the BT-Settl bolometric luminosity-age relationship (Allard et al. 2012). (d) Same as the previous plot with the LDB locus determined following the second scenario.
Current usage metrics show cumulative count of Article Views (full-text article views including HTML views, PDF and ePub downloads, according to the available data) and Abstracts Views on Vision4Press platform.
Data correspond to usage on the plateform after 2015. The current usage metrics is available 48-96 hours after online publication and is updated daily on week days.
Initial download of the metrics may take a while.