Fig. A.20.
Download original image
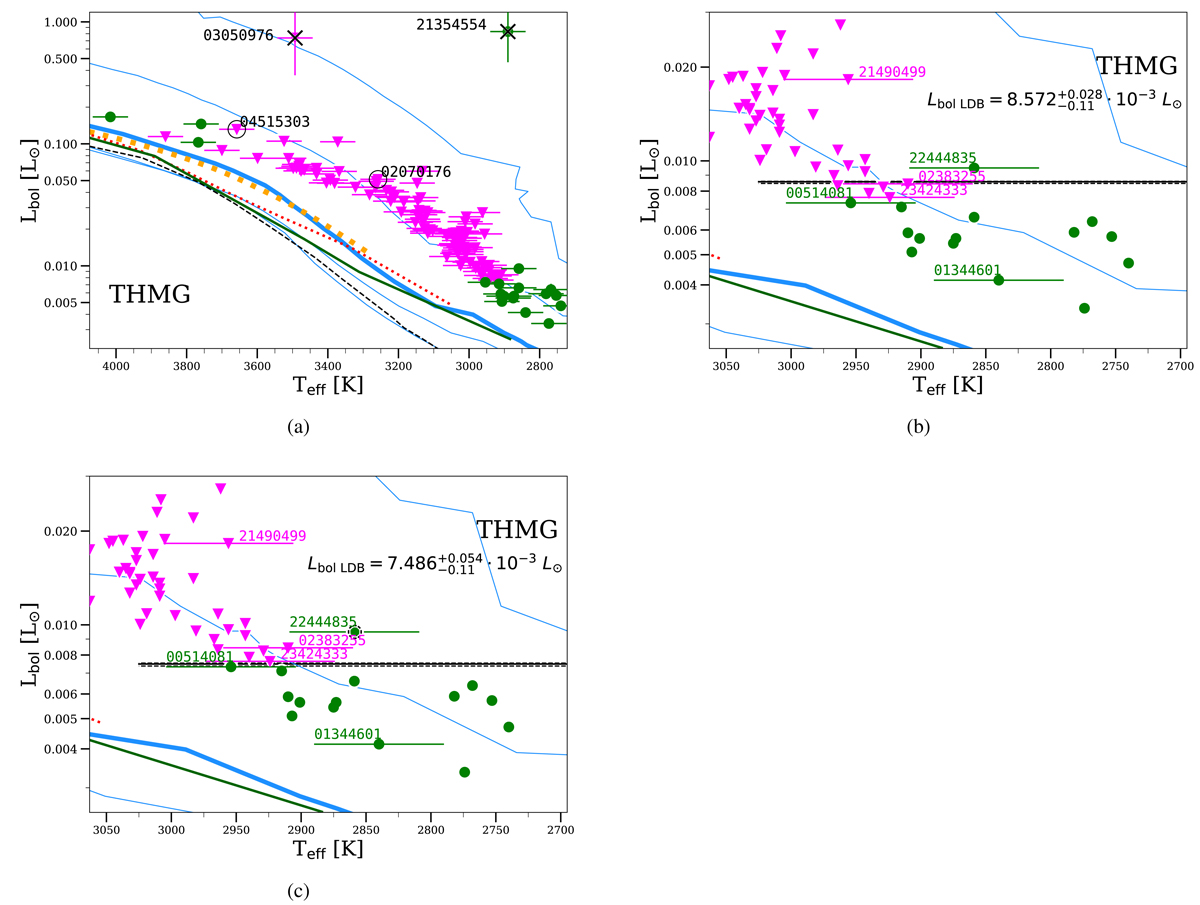
HRDs and the LDB for the THMG. (a) Same as in Fig. 6 but for THMG. Thin blue lines correspond to isochrones of 1, 10, 100 Ma, and 1 Ga from the BT-Settl models (Allard et al. 2013), while the thick blue one to 50 Ma. The figure includes 50 Ma isochrones from: D’Antona & Mazzitelli 1994 (black dashed line), and Siess et al. 2000 (red dotted line). It also includes a 40 Ma isochrone from Tognelli et al. 2011 (orange dashed dot line). (b) Zoom on the (a) plot around the LDB following the first scenario. To retain clarity, we have only drawn the effective temperature uncertainties and the names for the sources that defined the LDB and two additional sources. The uncertainties in the bolometric luminosities are usually smaller than the size of the symbols. (c) Same as (b), but the LDB is located following the second scenario (Section 2.11). The THMG is ![]() Ma old using the BT-Settl bolometric luminosity-age relationship (Allard et al. 2012).
Ma old using the BT-Settl bolometric luminosity-age relationship (Allard et al. 2012).
Current usage metrics show cumulative count of Article Views (full-text article views including HTML views, PDF and ePub downloads, according to the available data) and Abstracts Views on Vision4Press platform.
Data correspond to usage on the plateform after 2015. The current usage metrics is available 48-96 hours after online publication and is updated daily on week days.
Initial download of the metrics may take a while.